Concept explainers
Videos
Cost-Benefit of Emission Control A manufacturer plans to decrease the amount of sulphur dioxide escaping from its smokestacks. The estimated cost-benefit function is
Where
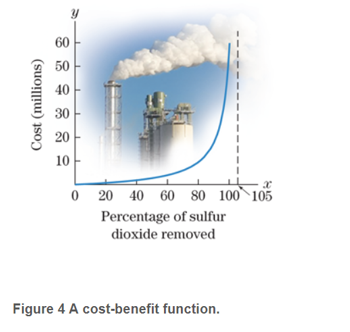 .
.
Want to see the full answer?
Check out a sample textbook solution
Chapter 3 Solutions
MyLab Math with Pearson eText -- Standalone Access Card -- for Calculus & Its Applications (14th Edition)


- Biology A science class performs an experiment comparing the quantity of food consumed by a species of moth with the quantity of food supplied. The model for the experimental data is y=1.568x0.0016.360x+1, x0 where x is the quantity (in milligrams) of food supplied and y is the quantity (in milligrams) of food consumed. (a) Use a graphing utility to graph this model. (b) At what level of consumption will the moth become satiated?arrow_forwardDrug Concentration When a drug is administered orally, it takes some time before the blood concentration reaches its maximum level. After that time, concentration levels decrease. When 500 milligrams of procainamide is administered orally, one model for a particular patient gives blood concentration C, in milligrams per liter, after t hours as C=2.65(e0.2te2t) What is the maximum blood-level concentration, and when does that level occur?arrow_forwardFlood Control A river is 8 feet above its flood stage. The water is receding at a rate of 3 inches per hour. Write a mathematical model that shows the number of feet above flood stage after t hours. Assuming the water continually recedes at this rate, when will the river be 1 foot above its flood stage?arrow_forward
- Finding hotel rates A 300-room hotel is two-thirds filled when the nightly room rate is 90. Experience has shown that each 5 increase in cost results in 10 fewer occupied rooms. Find the nightly rate that will maximize income.arrow_forwardGrazing Kangaroos The amount of vegetation eaten in a day by a grazing animal V of food available measured as biomass, in units such as pounds per acre. This relationship is called the functional response. If there is little vegetation available, the daily intake will be small, since the animal will have difficulty finding and eating the food. As the amount of food biomass increases, so does the daily intake. Clearly, though, there is a limit to the amount the animal will eat, regardless of the amount of food available. This maximum amount eaten is the satiation level. a.For the western grey kangaroo of Australia, the functional response is G=2.54.8e0.004V, where G=G(V) is the daily intake measured in pounds and V is the vegetation biomass measured in pounds per acre. i. Draw a graph of G against V. Include vegetation biomass levels up to 2000 pounds per acre. ii. Is the graph you found in part i concave up or concave down? Explain in practical terms what your answer means about how this kangaroo feeds. iii. There is a minimal vegetation biomass level below which the western grey kangaroo will eat nothing. Another way of expressing this is to say that the animal cannot reduce the food biomass below this level. Find this minimal level. iv. Find the satiation level for the western grey kangaroo. b. For the red kangaroo of Australia, the functional response is R=1.91.9e0.033V, Where R is the daily intake measured in pounds and V is the vegetation biomass measured in pounds per acre. i. Add the graph of R against V to the graph of G you drew in part a. ii. A simple measure of the grazing efficiency of an animal involves the minimal vegetation biomass level described above: The lower the minimal level for an animal, the more efficient it is at grazing. Which is more efficient at grazing, the western grey kangaroo or the red kangaroo?arrow_forwardConcentration of a Mixture A 1000-liter tank contains 50 liters of a 25brine solution. You add xliters of a 75brine solution to the tank. (a) Show that the concentration C, the proportion of brine to total solution, in the final mixture is C=3x+504(x+50). (b) Determine the domain of the function based on the physical constraints of the problem. (c) Sketch the graph of the concentration function. (d) As the tank is filled, what happens to the rate at which the concentration of brine is increasing? What percent does the concentration of brine appear to approach?arrow_forward
- Population Statistics The table shows the life expectancies of a child (at birth) in the United States for selected years from 1940 through 2010. A model for the life expectancy during this period is y=63.6+0.97t1+0.01t,0r70 Where y represents the life expectancy and t is the time in years, with t=0 corresponding to 1940. (a) Use a graphing utility to graph the data from the table and the model in the same viewing window. How well does the model fit the data? Explain (b) Determine the life expectancy in 1990 both graphically and algebraically. (c) Use the graph to determine the year when life expectancy was approximately 70.1. Verify your answer algebraically. (d) Identify the y-intercept of the graph of the model. What does it represent in the context of the problem? (e) Do you think this model can be used to predict the life expectancy of a child 50 years from now? Explainarrow_forwardBiology The metabolic rate of an ectothermic organism increases with increasing temperature within a certain range. Experimental data for the oxygen consumption C (in microliters per gram per hour) of a beetle at certain temperatures can be approximated by the model C=0.45x21.65x+50.75,10x25 where x is the air temperature in degrees Celsius. a The oxygen consumption is 150 microliters per gram per hour. What is the air temperature ? b When the air temperature increases from 10C to 20C, the oxygen consumption increases by approximately what factor ?arrow_forward

 Algebra & Trigonometry with Analytic GeometryAlgebraISBN:9781133382119Author:SwokowskiPublisher:Cengage
 College AlgebraAlgebraISBN:9781305115545Author:James Stewart, Lothar Redlin, Saleem WatsonPublisher:Cengage Learning
 Big Ideas Math A Bridge To Success Algebra 1: Stu...AlgebraISBN:9781680331141Author:HOUGHTON MIFFLIN HARCOURTPublisher:Houghton Mifflin Harcourt
 Functions and Change: A Modeling Approach to Coll...AlgebraISBN:9781337111348Author:Bruce Crauder, Benny Evans, Alan NoellPublisher:Cengage Learning
 College Algebra (MindTap Course List)AlgebraISBN:9781305652231Author:R. David Gustafson, Jeff HughesPublisher:Cengage Learning