
Videos
a.
Find the values
a.
Answer to Problem 16P
The values of
The values of
Explanation of Solution
Step-by-step procedure to verify
- Press STAT.
- Select Edit.
- Enter the values in L1.
- Press STAT and Choose CALC.
- Select 1-Var Stats.
- To select the variable L1, Press2-nd and then press 1.
- Press Enter.
The output obtained using the Ti83 calculator is as given below:
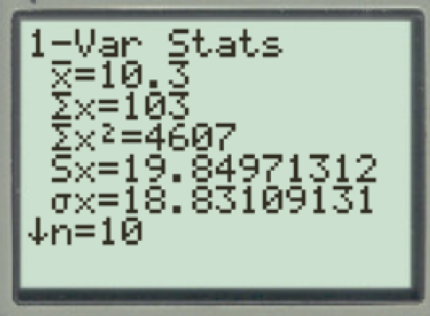
From the output, the values of
Step-by-step procedure to verify
- Press STAT.
- Select Edit.
- Enter the values in L2.
- Press STAT and Choose CALC.
- Select 1-Var Stats.
- To select the variable L2, Press2-nd and then press 2.
- Press Enter.
The output obtained using the Ti83 calculator is as given below:
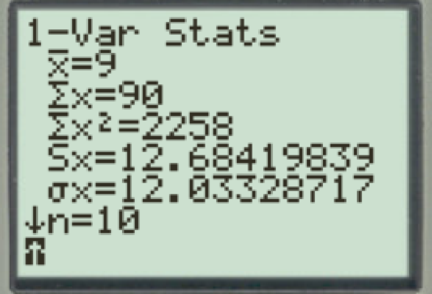
From the output, the values of
b.
Find the sample mean, variance, and standard deviation for x and y using the computation formula.
b.
Answer to Problem 16P
The values of sample mean, variance, and standard deviation for x using the computation formula are10.3, 394.0, and 19.85, respectively.
The values of sample mean, variance, and standard deviation for y using the computation formula are9, 160.9, and 12.68, respectively.
Explanation of Solution
The sample variance using the computation formula is as follows:
Where,
The sample standard deviation using the computation formula is as follows:
Where,
The sample mean for x is obtained as given below:
Thus, the sample mean is 10.3.
The sample variance for x using the computation formula is obtained as given below:
Thus, the sample variance for x using the computation formula is 394.0.
The sample standard deviation for x using the computation formula is as obtained below:
Thus, the sample standard deviation for x using the computation formula is 19.85.
The sample mean for y is obtained as given below:
Thus, the sample mean is 9.
The sample variance for y using the computation formula is obtained as given below:
Thus, the sample variance for y using the computation formula is 160.9.
The sample standard deviation for y using the computation formula is obtained as given below:
Thus, the sample standard deviation for y using the computation formula is 12.68.
c.
Find the 75% Chebyshev interval around the mean for each fund.
Compare the two funds.
c.
Answer to Problem 16P
The 75% Chebyshev interval around the mean for the fund Vanguard Total Stock Index is–29.4 and 50.
The 75% Chebyshev interval around the mean for the fund Vanguard Balanced Index is –16.36 and 34.36.
Explanation of Solution
The 75% Chebyshev interval around the mean for the fund Vanguard Total Stock Index is obtained as given below:
Thus, the 75% Chebyshev interval around the mean for the fund Vanguard Total Stock Index is –29.4 and 50.
The 75% Chebyshev interval around the mean for the fund Vanguard Balanced Index is obtained as given below:
Thus, the 75% Chebyshev interval around the mean for the fund Vanguard Balanced Index is –16.36 and 34.36.
From the result, it is observed that the 75% returns lie in the 75% Chebyshev interval for both the funds.
d.
Find and compare the coefficient of variation for x and y.
d.
Answer to Problem 16P
The coefficient of variation for x is 192.7%.
The coefficient of variation for y is 140.9%.
Explanation of Solution
The formula for the coefficient of variation is as follows:
Where, s is the sample standard deviation and
The coefficient of variation for x is obtained as given below:
Thus, the coefficient of variation for x is 192.7%.
The coefficient of variation for y is obtained as given below:
Thus, the coefficient of variation for y is 140.9%.
From the results, the coefficient of variation for the fund Vanguard Balanced Index is less when compared to the coefficient of variation for the fund Vanguard Total Stock Index. Hence, the fund Vanguard Balanced Index has less risk per unit of return. Hence, the fund Vanguard Balanced Index appears to be better.
Want to see more full solutions like this?
Chapter 3 Solutions
Understandable Statistics: Concepts and Methods


- Population Genetics In the study of population genetics, an important measure of inbreeding is the proportion of homozygous genotypesthat is, instances in which the two alleles carried at a particular site on an individuals chromosomes are both the same. For population in which blood-related individual mate, them is a higher than expected frequency of homozygous individuals. Examples of such populations include endangered or rare species, selectively bred breeds, and isolated populations. in general. the frequency of homozygous children from mating of blood-related parents is greater than that for children from unrelated parents Measured over a large number of generations, the proportion of heterozygous genotypesthat is, nonhomozygous genotypeschanges by a constant factor 1 from generation to generation. The factor 1 is a number between 0 and 1. If 1=0.75, for example then the proportion of heterozygous individuals in the population decreases by 25 in each generation In this case, after 10 generations, the proportion of heterozygous individuals in the population decreases by 94.37, since 0.7510=0.0563, or 5.63. In other words, 94.37 of the population is homozygous. For specific types of matings, the proportion of heterozygous genotypes can be related to that of previous generations and is found from an equation. For mating between siblings 1 can be determined as the largest value of for which 2=12+14. This equation comes from carefully accounting for the genotypes for the present generation the 2 term in terms of those previous two generations represented by for the parents generation and by the constant term of the grandparents generation. a Find both solutions to the quadratic equation above and identify which is 1 use a horizontal span of 1 to 1 in this exercise and the following exercise. b After 5 generations, what proportion of the population will be homozygous? c After 20 generations, what proportion of the population will be homozygous?arrow_forwardLet X and Y be random variables, and a and b be constants. ???? a) Show that Cov [aX,bY] = abCov [X,Y] . b) Show that if a > 0 and b > 0, then the correlation coefficient between aX and bY is the same as the correlation coefficient between X and Y . c) Is the correlation coefficient between X and Y unaffected by changes in the units of X and Y ?arrow_forwardThickness measurements of a coating process are made to the nearest hundredth of a millimeter. The thickness measurements are uniformly distributed with values 0.110, 0.111, 0.112, 0.113, and 0.114. a). What is the probability that the thickness is less than 0.113? b). What is the probability that the thickness is between 0.111 and 0.113? c). Determine the mean of the coating thickness for this process. d). Determime the variance of the coating thickness for this process.arrow_forward
- Discrete random variable Y has the CDF FY(y) as shown below. Find the variance of the random variable Y.arrow_forwarda = 3 b = 0 A new mushroom with Shape=C, Color=G, and Odor=1 has been spotted. Using Naive Bayesian method, find the posterior probability that it is edible. (Use Laplace-corrected probabilities. Give the answer in decimal, not in percentage.)arrow_forwardhapter 1, Section 2, Exercise 041 The population is the approximately 29,000 protein-coding genes in human DNA. Each gene is assigned a number (from 1 to 29,000), and computer software is used to randomly select 500 of these numbers yielding a sample of 500 genes.State whether or not the sampling method described produces a random sample from the given population. Random Not randomarrow_forward
- Four buses carrying a total of 160 students from the same school arrive at a football stadium. The buses carry, respectively, 45, 20, 35, and 60 students. One of the four bus drivers is randomly selected. Let X denote the number of students that were on the randomly selected driver’s bus. (a) Determine the probability mass function of X. (b) Find the mean, E[X]. (c) Find the variance, V[X].arrow_forwardA) Use the moment-generating function to calculate the first moment u1 B) A) Use the moment-generating function to calculate the first moment u2 C)What is the mean and variance of the random variable Yarrow_forwardA grade in a probability course depends on exam scores X1 and X2. The professor, afan of probability, releases exam scores in a normalized fashion such that X1 and X2 are independentGaussian (μ = 0, σ = √2) random variables. The semester average is X = 0.5(X1 + X2). 1. A student was to earn an A grade if X > 1. What is P(A)?2. To improve the RS (Rating Service) score, the professor decides he should award more A’s. Now you get an A if max(X1, X2) > 1. What is P(A) now?3. The professor found out he is unpopular and decides to award an A if either X > 1 or max(X1, X2) > 1. Now what is P(A)?4. Under criticism of grade inflation from the department chair, the professor adopts a new policy. An A is awarded if max(X1, X2) > 1 and min(X1, X2) > 0. Now what is P(A)? Detailed explanation and calculation would be much appreciated.arrow_forward
- Discrete Random Variables Consider the experiment of throwing 2 dice and define Y as the V.A that records the sum of the results. records the sum of the outcomes. Find the probability function fY(y), the expected value E(Y ), the variance V ar(Y ), and the cumulative expected value E(Y ), the variance V ar(Y ), and the cumulative distribution function FY(y)arrow_forward(Reliability Analysis) Consider the following system, Assume that the lifetimes of the first and second components are geometrically distributed with mean 2 hours (Geo(1/2)), the lifetime of the third component is geometrically distributed with mean 4 hours (Geo(1/4)) and the lifetime of the fourth component is geometrically distributed with mean 3 hour (Geo(1/3)). (a) Construct the structure function for this system.(b) Compute the probability that the system survives for more than 2 hours. (c) Compute the expected lifetime of the system.arrow_forwardWater Consumption The Old Farmer's Almanac stated that the average consumption of water per person per day was 123 gallons. To test the hypothesis that this figure may no longer be true, a researcher randomly selected 25 people and found that they used on average 120.7 gallons per day and s= 5.3. At a = 0.01, is there enough evidence to say that the Old Farmer's Almanac figure might no longer be correct? Use the P-value method. Assume the population is normally distributed. Use a TI-83 Plus/TI-84 Plus calculator. find the p valuearrow_forward
 Functions and Change: A Modeling Approach to Coll...AlgebraISBN:9781337111348Author:Bruce Crauder, Benny Evans, Alan NoellPublisher:Cengage Learning
 Algebra & Trigonometry with Analytic GeometryAlgebraISBN:9781133382119Author:SwokowskiPublisher:Cengage