
Concept explainers
Videos
a.
Find the values
a.
Answer to Problem 18P
The values of
The values of
Explanation of Solution
Step-by-step procedure to verify
- Press STAT.
- Select Edit.
- Enter the values in L1.
- Press STAT and Choose CALC.
- Select 1-Var Stats.
- To select the variable L1, Press 2-nd, and then press 1.
- Press Enter.
Output obtained using the Ti83 calculator is given below:
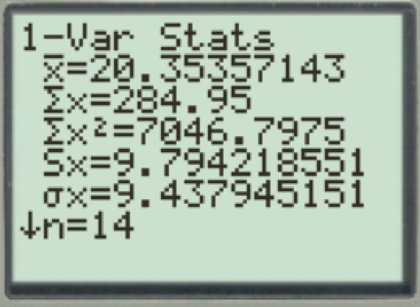
From the output, the values of
Step-by-step procedure to verify
- Press STAT.
- Select Edit.
- Enter the values in L2.
- Press STAT and Choose CALC.
- Select 1-Var Stats.
- To select the variable L2, Press 2-nd, and then press 2.
- Press Enter.
Output obtained using the Ti83 calculator is given below:
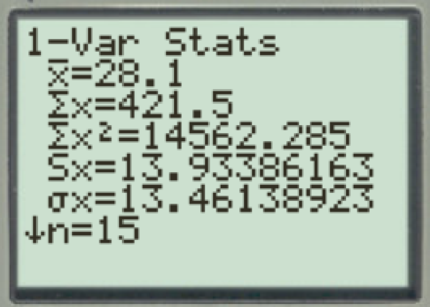
From the output, the values of
b.
Find the sample mean, variance, and standard deviation for x and y using the computation formula.
b.
Answer to Problem 18P
The values of sample mean, variance, and standard deviation for x using the computation formula is 20.35, 96 and 9.79.
The values of sample mean, variance, and standard deviation for y using the computation formula is 28.1, 194 and 13.93.
Explanation of Solution
The sample variance using the computation formula is as follows:
Where,
The sample standard deviation using the computation formula is as follows:
Where,
The sample mean for x is obtained below:
Thus, the sample mean is 20.35.
The sample variance for x using the computation formula is obtained below:
Thus, the sample variance for x using the computation formula is 96.
The sample standard deviation for x using the computation formula is obtained below:
Thus, the sample standard deviation for x using the computation formula is 9.79.
The sample mean for y is obtained below:
Thus, the sample mean is 28.1.
The sample variance for y using the computation formula is obtained below:
Thus, the sample variance for y using the computation formula is 194.
The sample standard deviation for y using the computation formula is obtained below:
Thus, the sample standard deviation for y using the computation formula is 13.93.
c.
Find the 75% Chebyshev interval around the mean for each fund.
Compare the two grids.
c.
Answer to Problem 18P
The 75% Chebyshev interval around the mean for the Grid E is 0.77 and 39.93.
The 75% Chebyshev interval around the mean for the Grid H is 0.24 and 55.96.
Explanation of Solution
The 75% Chebyshev interval around the mean for the Grid Eis obtained below:
Thus, the 75% Chebyshev interval around the mean for the Grid E is 0.77 and 39.93.
The 75% Chebyshev interval around the mean for the Grid H is obtained below:
Thus, the 75% Chebyshev interval around the mean for the Grid H is 0.24 and 55.96.
From the result, it is observed that the 75% Chebyshev interval around the mean for the Grid H is wider when compared to the Grid E.
d.
Find and compare the coefficient of variation for x and y.
d.
Answer to Problem 18P
The coefficient of variation for x is 48%.
The coefficient of variation for y is 50%.
Explanation of Solution
The formula for the coefficient of variation is as follows:
Where, s is the sample standard deviation and
The coefficient of variation for x is obtained below:
Thus, the coefficient of variation for x is 48%.
The coefficient of variation for y is obtained below:
Thus, the coefficient of variation for y is 50%.
From the results, the coefficient of variation for the Grid E is less when compared to the coefficient of variation for the Grid H. Hence, the Grid H has more buried artifacts.
Want to see more full solutions like this?
Chapter 3 Solutions
Understandable Statistics: Concepts and Methods


- Ion Concentration The pH reading of a sample of each substance is given. Calculate the hydrogen ion concentration of the substance. a Vinegar: pH=3.0 b Milk: pH=6.5arrow_forwardRunning Speed A man is running around a circular track that is 200 m in circumference. An observer uses a stopwatch to record the runners time at the end of each lap, obtaining the data in the following table. aWhat was the mans average speed rate between 68 s and 152 s? bWhat was the mans average speed between 263 s and 412 s? cCalculate the mans speed for each lap. Is he slowing down, speeding up or neither? Time s Distance m 32 200 68 400 108 600 152 800 203 1000 263 1200 335 1400 412 1600arrow_forwardRunning Speed A man is running around a circular track that is 200 m in circumference. An observer uses a stopwatch to record the runner’s time at the each of each lap, obtaining the data in the following table. (a) What was the man’s average speed (rate) between 68 s and 152 s? (b) What was the man’s average speed between 263 s and 412 s? (c) Calculate the man’s speed for cadi lap, Is he slowing down, speeding up, or neither?arrow_forward
- Stock Turnover at Retail In retail sales, an important marker of retail activity is the stock turnover at retail. This figure is calculated for a specific period of time as the total net sales divided by the retail value of the average stock during that time, where both are measured in dollars. As a formula, this is written Stockturnover=NetsalesAveragestockatretail. This formula expresses stock turnover as a function of net sales and average stock at retail. a. Suppose that your store had net sales of 682, 000 in mens shoes over the past six months and that the retail value of the average stock of mens shoes was 163, 000. What was the stock turnover at retail for that time period? b. Suppose that in a certain month, your stores net sales of womens dresses were 83, 000 and that the usual stock turnover at retail is 0.8 per month. What do you estimate to be your stores average stock at retail? c. Solve the equation for average stock at retail- that is, write a formula giving average stock at retail as a function of stock turnover and net sales. d. Suppose that in a certain time period, your store had an average stock of socks with a retail value of 45, 000 and a stock turnover at retail of 1.6. What were the stores net sales of socks during that time period? e. Solve the equation for net sales- that is, write a formula giving net sales as a function of stock turnover and average stock at retail.arrow_forwardFindingpH hydrogen ion concentration of a sample of each substance is given. Calculate the pH Of the substance. (a) Lemon juice: [H+]=5.0103M (b) Tomatojuice: [H+]=3.2104M (c) seawater: [H+]=5.0109Marrow_forward
 Linear Algebra: A Modern IntroductionAlgebraISBN:9781285463247Author:David PoolePublisher:Cengage Learning
 Algebra & Trigonometry with Analytic GeometryAlgebraISBN:9781133382119Author:SwokowskiPublisher:Cengage
 Functions and Change: A Modeling Approach to Coll...AlgebraISBN:9781337111348Author:Bruce Crauder, Benny Evans, Alan NoellPublisher:Cengage Learning
 Algebra and Trigonometry (MindTap Course List)AlgebraISBN:9781305071742Author:James Stewart, Lothar Redlin, Saleem WatsonPublisher:Cengage Learning
 College AlgebraAlgebraISBN:9781305115545Author:James Stewart, Lothar Redlin, Saleem WatsonPublisher:Cengage Learning
 Trigonometry (MindTap Course List)TrigonometryISBN:9781337278461Author:Ron LarsonPublisher:Cengage Learning