
Understandable Statistics: Concepts and Methods
12th Edition
ISBN: 9781337119917
Author: Charles Henry Brase, Corrinne Pellillo Brase
Publisher: Cengage Learning
expand_more
expand_more
format_list_bulleted
Concept explainers
Videos
Textbook Question
Chapter 3.3, Problem 11P
Auto Insurance: Interpret Graphs Consumer Reports rated automobile insurance companies and listed annual premiums for top-rated companies in several states. Figure 3-9 shows box-and-whisker plots for annual premiums for urban customers (married couple with one 17-year-old son) in three states. The box-and-whisker plots in Figure 3-9 were all drawn using the same scale on a TI-84Plus/TI-83Plus/TI-nspire calculator.
FIGURE 3-9
Insurance Premium (annual, urban)
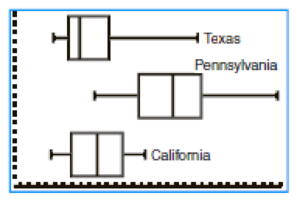
- (a) Which state has the lowest premium? the highest?
- (b) Which state has the highest median premium?
- (c) Which state has the smallest
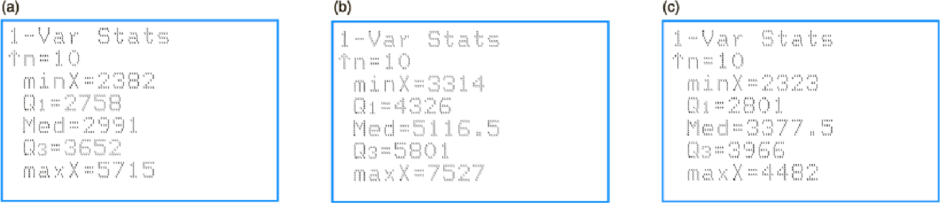
range of premiums? the smallestinterquartile range ? - (d) Figure 3-10 gives the
five-number summaries generated on the TI-84Plus/TI-83Plus/TI-nspire calculators for the box-and-whisker plots of Figure 3-9. Match the five-number summaries to the appropriate box-and-whisker plots.
FIGURE 3-10
Five-Number Summaries for Insurance Premiums
Expert Solution & Answer
Want to see the full answer?
Check out a sample textbook solution
Students have asked these similar questions
Figure I shows the age and annual DDS expenditures for 376 Hispanic and 401 white non hispanic DDS recipients. Based on the scatter plot, determine whether each of the following statements is TRUE or FALSE no explanaition is needed:
Older DDS recipients generally had higher annual DDS expenditures
The histogram of annual DDS expenditures would be unimodal.
The median annual DDS expenditures of these DDS recipients would be higher than their mean annual DDS expenditures.
Answer question #9. Show the graph of the rejection region.
Given the following data on lawnmower engine emissions and age of the lawnmower
Age Emission
0 1.72
0 4.38
2 4.06
11 1.26
7 5.31
16 0.57
9 3.37
0 3.44
12 0.74
4 1.24
Construct a scatterplot of emissions versus age
What are the characteristics of the scatter plot? Do age and emission appear to be related?
Chapter 3 Solutions
Understandable Statistics: Concepts and Methods
Ch. 3.1 - Statistical Literacy Consider the mode, median,...Ch. 3.1 - Prob. 2PCh. 3.1 - Prob. 3PCh. 3.1 - Prob. 4PCh. 3.1 - Prob. 5PCh. 3.1 - Basic Computation: Mean, Median, Mode Find the...Ch. 3.1 - Prob. 7PCh. 3.1 - Critical Thinking Consider a data set with at...Ch. 3.1 - Critical Thinking Consider a data set with at...Ch. 3.1 - Prob. 10P
Ch. 3.1 - Critical Thinking When a distribution is...Ch. 3.1 - Critical Thinking Consider the following types of...Ch. 3.1 - Critical Thinking Consider the numbers 2 3 4 5 5...Ch. 3.1 - Prob. 14PCh. 3.1 - Prob. 15PCh. 3.1 - Prob. 16PCh. 3.1 - Prob. 17PCh. 3.1 - Critical Thinking Consider a data set of 15...Ch. 3.1 - Prob. 19PCh. 3.1 - Prob. 20PCh. 3.1 - Prob. 21PCh. 3.1 - Football: Age of Professional Players How old are...Ch. 3.1 - Prob. 23PCh. 3.1 - Prob. 24PCh. 3.1 - Prob. 25PCh. 3.1 - Prob. 26PCh. 3.1 - Prob. 27PCh. 3.1 - Prob. 28PCh. 3.1 - Expand Your Knowledge: Harmonic Mean When data...Ch. 3.1 - Prob. 30PCh. 3.2 - Statistical Literacy Which averagemean, median, or...Ch. 3.2 - Statistical Literacy What is the relationship...Ch. 3.2 - Statistical Literacy When computing the standard...Ch. 3.2 - Prob. 4PCh. 3.2 - Prob. 5PCh. 3.2 - Basic Computation: Range, Standard Deviation...Ch. 3.2 - Critical Thinking For a given data set in which...Ch. 3.2 - Prob. 8PCh. 3.2 - Prob. 9PCh. 3.2 - Prob. 10PCh. 3.2 - Prob. 11PCh. 3.2 - Critical Thinking: Outliers One indicator of an...Ch. 3.2 - Prob. 13PCh. 3.2 - Basic Computation: Coefficient of Variation,...Ch. 3.2 - Prob. 15PCh. 3.2 - Prob. 16PCh. 3.2 - Space Shuttle: Epoxy Kevlar epoxy is a material...Ch. 3.2 - Prob. 18PCh. 3.2 - Prob. 19PCh. 3.2 - Prob. 20PCh. 3.2 - Prob. 21PCh. 3.2 - Prob. 22PCh. 3.2 - Prob. 23PCh. 3.2 - Prob. 24PCh. 3.2 - Prob. 25PCh. 3.2 - Prob. 26PCh. 3.2 - Brain Teaser: Sum of Squares If you like...Ch. 3.2 - Prob. 28PCh. 3.2 - Prob. 29PCh. 3.2 - Prob. 30PCh. 3.3 - Statistical Literacy Angela took a general...Ch. 3.3 - Prob. 2PCh. 3.3 - Prob. 3PCh. 3.3 - Prob. 4PCh. 3.3 - Prob. 5PCh. 3.3 - Basic Computation: Five-Number Summary,...Ch. 3.3 - Health Care: Nurses At Center Hospital there is...Ch. 3.3 - Prob. 8PCh. 3.3 - Prob. 9PCh. 3.3 - Sociology: High School Dropouts What percentage of...Ch. 3.3 - Auto Insurance: Interpret Graphs Consumer Reports...Ch. 3.3 - Prob. 12PCh. 3 - Prob. 1CRPCh. 3 - Critical Thinking Look at the two histograms...Ch. 3 - Critical Thinking Consider the following Minitab...Ch. 3 - Prob. 4CRPCh. 3 - Political Science: Georgia Democrats How...Ch. 3 - Grades: Weighted Average Professor Cramer...Ch. 3 - Prob. 7CRPCh. 3 - Agriculture: Harvest Weight of Maize The following...Ch. 3 - Prob. 9CRPCh. 3 - Agriculture: Bell Peppers The pathogen...Ch. 3 - Performance Rating: Weighted Average A performance...Ch. 3 - Prob. 1DHCh. 3 - Prob. 2DHCh. 3 - Prob. 1UTCh. 3 - Prob. 1CURPCh. 3 - Describe how the presence of possible outliers...Ch. 3 - Prob. 3CURPCh. 3 - Prob. 4CURPCh. 3 - Prob. 5CURPCh. 3 - Prob. 6CURPCh. 3 - Prob. 7CURPCh. 3 - In west Texas, water is extremely important. The...Ch. 3 - Prob. 9CURPCh. 3 - Prob. 10CURPCh. 3 - Prob. 11CURPCh. 3 - In west Texas, water is extremely important. The...Ch. 3 - Prob. 13CURPCh. 3 - Prob. 14CURPCh. 3 - Prob. 15CURPCh. 3 - In west Texas, water is extremely important. The...Ch. 3 - Prob. 17CURP
Knowledge Booster


Learn more about
Need a deep-dive on the concept behind this application? Look no further. Learn more about this topic, statistics and related others by exploring similar questions and additional content below.Similar questions
- These dot plots show hourly earnings for a sample of workers in two different careers.arrow_forwardQuestion 5: A college is interested in if the year of receiving high-level education (college and above) influences students’ salaries when they join the working field. The college randomly selected 4 students who recently received a full- time work offer and collected their year of receiving high-level education and salary per week. The raw data is: Participant Year of high-level education Salary per week Participant 1 4 1150 Participant 2 5 1300 Participant 3 7 1600 Participant 4 2 750 Plot the scatterplot and label the participants. Calculate the correlation coefficient between the year of high-level education and salary per week. Calculate the regression equation using the year of receiving high-level education to predict the salary per week. If a student graduate from college and graduate school in a total of 6 years, what is this student’s predicted salary per week?arrow_forwardThe data in the table characterizes the income distribution for a country. Income category Share of income (%) Cumulative share of income (%) first quintile 7.0 --- second quintile 9.0 16.0 third quintile --- 37.0 fourth quintile 25.0 --- fifth quintile 38.038.0 --- What percentage of the total population is categorized as belonging to the second quintile? Give your responses as whole numbers. Percentage of population in second quintile:__________% What percentage of the total income for the country is earned by the third quintile? Percentage earned by the third quintile:__________% What is the cumulative share of income earned by the poorest 80% of the population? Percentage earned by the poorest 80%:__________%arrow_forward
Recommended textbooks for you
 Linear Algebra: A Modern IntroductionAlgebraISBN:9781285463247Author:David PoolePublisher:Cengage Learning
Linear Algebra: A Modern Introduction
Algebra
ISBN:9781285463247
Author:David Poole
Publisher:Cengage Learning
The Shape of Data: Distributions: Crash Course Statistics #7; Author: CrashCourse;https://www.youtube.com/watch?v=bPFNxD3Yg6U;License: Standard YouTube License, CC-BY
Shape, Center, and Spread - Module 20.2 (Part 1); Author: Mrmathblog;https://www.youtube.com/watch?v=COaid7O_Gag;License: Standard YouTube License, CC-BY
Shape, Center and Spread; Author: Emily Murdock;https://www.youtube.com/watch?v=_YyW0DSCzpM;License: Standard Youtube License