
Videos
a.
Check whether there is a guaranteed amount of water the farmers, ranchers, and cities will get from the Yellowstone River each year.
a.
Answer to Problem 9CRP
No, there is no guaranteed amount of water the farmers, ranchers, and cities get from the Yellowstone River each year.
Explanation of Solution
The important source of water for wildlife, rancher, farmers, and cities downstream is Yellowstone River. The data show that the annual flow for recent 19 years of the Yellowstone River, which does not show any guarantee that they give water for each year.
The annual flows are random variables. Hence, there is no guaranteed amount of water the farmers, ranchers, and cities will get from the Yellowstone River each year.
b.
Find the expected annual flow from the Yellowstone snowmelt.
Find the mean, median, and
b.
Answer to Problem 9CRP
The expected annual flow from the Yellowstone snowmelt is 27.05.
The value of mean is 27.05.
The value of median is 25.9.
The value of mode is 25.9.
Explanation of Solution
Step-by-step procedure to obtain the mean, median, and mode using the MINITAB software:
- Choose Stat > Basic Statistics > Display
Descriptive Statistics . - In Variables enter the columns Annual flow.
- Check Options, Select Mean, Median and Mode.
- Click OK in all dialogue boxes.
The output obtained using the MINITAB software is given below:
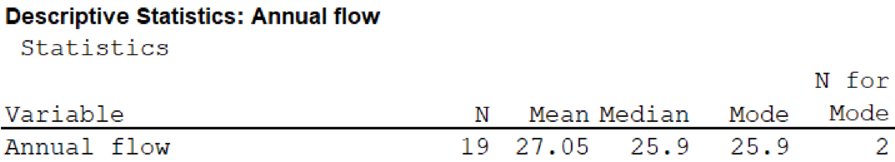
From the MINITAB output, the value of mean is 27.05, the value of median is 25.9, and the value of mode is 25.9.
c.
Find the
c.
Answer to Problem 9CRP
The range is 27.6.
The value of standard deviation is 6.61.
Explanation of Solution
Step-by-step procedure to obtain the range and standard deviation using the MINITAB software:
- Choose Stat > Basic Statistics > Display Descriptive Statistics.
- In Variables enter the columns Annual flow.
- Check Options, Select Mean, Median and Mode.
- Click OK in all dialogue boxes.
The output obtained using the MINITAB software is given below:
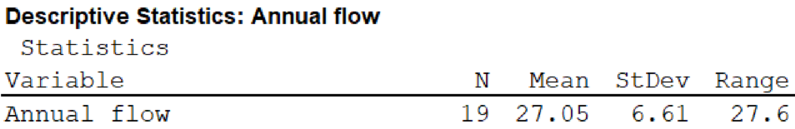
From the MINITAB output, the range is 27.6 and the value of standard deviation is 6.61.
d.
Find the 75% Chebyshev interval around the mean.
d.
Answer to Problem 9CRP
The 75% Chebyshev interval around the mean is 13.83 and 40.27.
Explanation of Solution
The 75% Chebyshev interval around the mean is obtained below:
Thus, the 75% Chebyshev interval around the mean for Grid E is 0.77 and 39.93.
e.
Find the five-number summary of the annual water flow.
Draw the box-and-whisker plot.
Interpret the five-number summary and box-and-whisker plot.
Find the values where the middle portion of the data lies.
Find the
Identify the data outliers.
e.
Answer to Problem 9CRP
The five-number summary of the annual water flow is 17.5, 23.7, 25.9, 31.8, and 45.1.
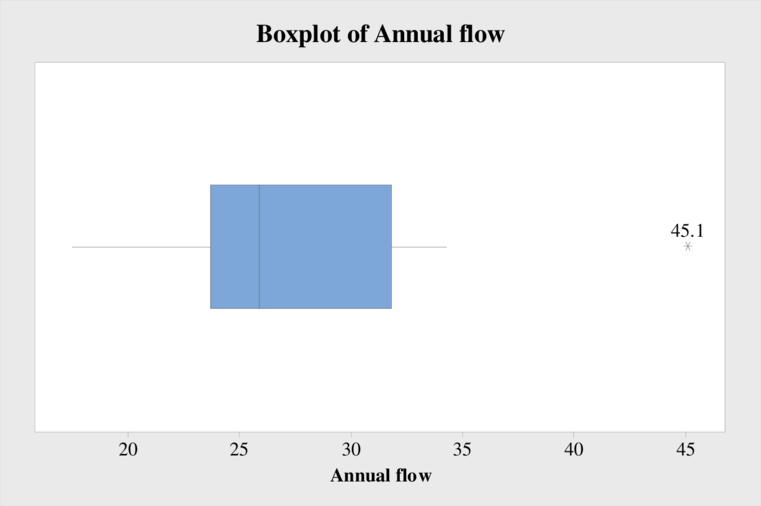
The box-and-whisker plot is shown below:
The middle portion of the data lies between 23.7 and 31.8.
The value of interquartile range is 8.1.
The value 45.1 is an outlier.
Explanation of Solution
Step-by-step procedure to obtain the five-number summary of the annual water flow using MINITAB software:
- Choose Stat > Basic Statistics > Display Descriptive Statistics.
- In Variables enter the columns Annual flow.
- Check Options, Select Minimum, Maximum, first
quartile , Median, third quartile and IQR. - Click OK in all dialogue boxes.
The output obtained using the MINITAB software is given below:
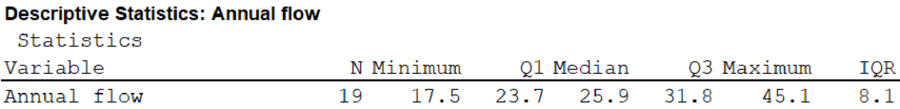
From the MINITAB output, the five-number summary of annual water flow is 17.5, 23.7, 25.9, 31.8, and 45.1.
Step-by-step procedure to draw the box-and-whisker plot using the MINITAB software:
- Choose Graph > Boxplot or Stat > EDA > Boxplot.
- Under One Y, choose Simple. Click OK.
- In Graph variables, enter the data of Annual flow.
- Click OK in all dialogue boxes.
Interpretation:
From the box-and-whisker plot, it is observed that the distribution of the annual water flow is skewed to the right.
From the output, it is observed that the middle portion of the data lies between 23.7 and 31.8.
From the MINITAB output, the value of interquartile range is 8.1.
From the box-and-whisker plot, it is observed that the value 45.1 is an outlier.
f.
Check whether the Madison is more reliable using the coefficient of variation.
f.
Explanation of Solution
Step-by-step procedure to obtain the coefficient of variation using the MINITAB software:
- Choose Stat > Basic Statistics > Display Descriptive Statistics.
- In Variables enter the columns Yellowstone and Madison.
- Check Options, Select coefficient of variation.
- Click OK in all dialogue boxes.
The output obtained using the MINITAB software is given below:
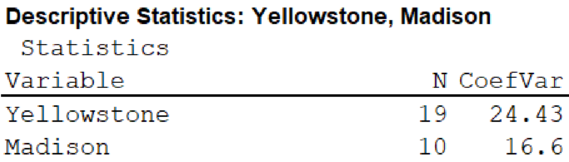
From the MINITAB output, the coefficient of variation for the annual water flow of Yellowstone is 24.43, and the coefficient of variation for the annual water flow of Madison is 16.6.
From the result, it is observed that the coefficient of variation for the water flow of Madison is smaller when compared to the coefficient of variation for the annual water flow of Yellowstone. This indicates that the spread of river flow is smaller for Madison river. Hence, the Madison flower is more consistent.
g.
Check whether it is safe to allocate at least 27 units of Yellowstone River water each year for agricultural and domestic use.
g.
Explanation of Solution
From the results, it is observed that the median water flow of Yellowstone River is 25.9, which indicates that more than half of the river flows are below 27 units.
Hence, it is not safe to allocate at least 27 units of Yellowstone River water each year for agricultural and domestic use.
Want to see more full solutions like this?
Chapter 3 Solutions
Understandable Statistics: Concepts and Methods


- Measurement Use the fact that 13 inches is approximately the same length as 33 centimeters to find a mathematical model that relates centimeters y to inches x. Then use the model to find the numbers of centimeters in 10 inches and 20 inches.arrow_forwardShadow Length A person who is 6 feet tall walks away from a 50-foot tower toward the tip of the tower’s shadow. At a distance of 32 feet from the tower, the person’s shadow begins to emerge beyond the tower’s shadow. How much farther must the person walk to be completely out of the tower’s shadow?arrow_forwardConstruction Costs The town of Foxton lies 10 mi north of an abandoned east-west road that runs through Grimley, as shown in the figure. The point on the abandoned road closed to Foxton is 40 mi from Grimley. Country officials are about to build a new road connecting the two towns. They have determined that restoring the old road would cost 100,000 per mile, while building a new road would cost 200, 000 per mile. How much of the abandoned road should be used as indicated in the figure if the officials intend to spend exactly 6.8 million? Would it cost less than this amount to build a new road connecting the towns directly?arrow_forward
 College Algebra (MindTap Course List)AlgebraISBN:9781305652231Author:R. David Gustafson, Jeff HughesPublisher:Cengage Learning
 Algebra for College StudentsAlgebraISBN:9781285195780Author:Jerome E. Kaufmann, Karen L. SchwittersPublisher:Cengage Learning
 Intermediate AlgebraAlgebraISBN:9781285195728Author:Jerome E. Kaufmann, Karen L. SchwittersPublisher:Cengage Learning
 Big Ideas Math A Bridge To Success Algebra 1: Stu...AlgebraISBN:9781680331141Author:HOUGHTON MIFFLIN HARCOURTPublisher:Houghton Mifflin Harcourt
 Algebra & Trigonometry with Analytic GeometryAlgebraISBN:9781133382119Author:SwokowskiPublisher:Cengage
 Glencoe Algebra 1, Student Edition, 9780079039897...AlgebraISBN:9780079039897Author:CarterPublisher:McGraw Hill