Concept explainers
Videos
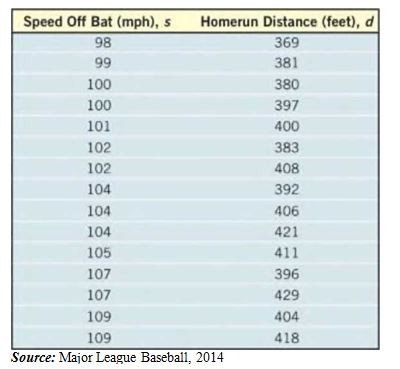
Homeruns A baseball analyst wishes to find a function that relates the distance, , of a homerun and the speed, , of the ball off the bat. Consider the data shown to the right.
(a) Does the relation defined by the set of orders pairs represent a function?
(b) Draw a
(c) Using a graphing utility, find the line of best fit that models the relation between the speed off the bat and the distance of the homerun?
(d) Interpret the slope.
(e) Express the relationship found in part (c), using function notation.
(f) What is the domain of the function?
(g) Predict the homerun distance if the speed of the ball off the bat is 103 miles per hour.
Want to see the full answer?
Check out a sample textbook solution
Chapter 3 Solutions
Student's Solutions Manual for Precalculus Enhanced with Graphing Utilites


- Maximum Volume An open box of maximum volume is made from a square piece of material 24 centimeters on a side by cutting equal squares from the corners and turning up the sides (see figure). (a) The table shows the volumes V (in cubic centimeters) of the box for various heights x (in centimeters). Use the table to estimate the maximum volume. (b) Plot the points (x,V) from the table in part (a). Does the relation defined by the ordered pairs represent V as a function of x ? (c) Given that V is a function of x, write the function and determine its domain.arrow_forwardRevenue The table shows the monthly revenue y (in thousands of dollars) of a landscaping business for each month of the year 2016, with x=1 representing January. A mathematical model that represents these data is fx1.97x+26.30.505x21.47x+6.3. (a) Use a graphing utility to graph the model. What is the domain of each part of the piecewise-defined function? How can you tell? (b) Find f5 and f11 and interpret your results in the context of the problem. (c) How do the values obtained from the model in part b compare with the actual data values?arrow_forwardHOW DO YOU SEE IT? The graphs labeled L1,L2,L3, and L4 represent four different pricing discounts, where p is the original price (in dollars) and S is the sale price (in dollars). Match each function with its graph. Describe the situations in parts c and d. a fp:A50 discount is applied. b gp:A$5 discount is applied. c gfp d fgparrow_forward
 Trigonometry (MindTap Course List)TrigonometryISBN:9781337278461Author:Ron LarsonPublisher:Cengage Learning
 Glencoe Algebra 1, Student Edition, 9780079039897...AlgebraISBN:9780079039897Author:CarterPublisher:McGraw Hill
 College Algebra (MindTap Course List)AlgebraISBN:9781305652231Author:R. David Gustafson, Jeff HughesPublisher:Cengage Learning
 Algebra & Trigonometry with Analytic GeometryAlgebraISBN:9781133382119Author:SwokowskiPublisher:Cengage
 Holt Mcdougal Larson Pre-algebra: Student Edition...AlgebraISBN:9780547587776Author:HOLT MCDOUGALPublisher:HOLT MCDOUGAL