
Concept explainers
Videos
Advertising Spend by Companies. Advertising Age annually compiles a list of the 100 companies that spend the most on advertising. Consumer-goods company Procter & Gamble has often topped the list, spending billions of dollars annually. Consider the data found in the file Advertising. It contains annual advertising expenditures for a sample of 20 companies in the automotive sector and 20 companies in the department store sector.
- a. What is the mean advertising spent for each sector?
- b. What is the standard deviation for each sector?
- c. What is the
range of advertising spent for each sector? - d. What is the
interquartile range for each sector? - e. Based on this sample and your answers to parts (a) to (d), comment on any differences in the advertising spending in the automotive companies versus the department store companies.
a.
Find the mean advertising spent for each sector.
Answer to Problem 32E
The mean annual advertising expenditure in the automotive sector is 1,960.1.
The mean annual advertising expenditure in the Department Store sector is 692.85.
Explanation of Solution
Calculation:
The data represent the annual advertising expenditures for a sample of 20 companies in the automotive sector and another sample of 20 companies in the department store sector.
Automotive sector:
Software procedure:
Step by step procedure to obtain the descriptive statistics using EXCEL is as follows:
- In an EXCEL sheet enter the values of first sample and label it as Automotive.
- Go to Data > Data Analysis (in case it is not default, take the Analysis ToolPak from Excel Add Ins) > Descriptive statistics.
- Enter Input Range as $A$2:$A$21, select Columns in Grouped By, tick on Summary statistics.
- Click on OK.
Output using EXCEL is given as follows:
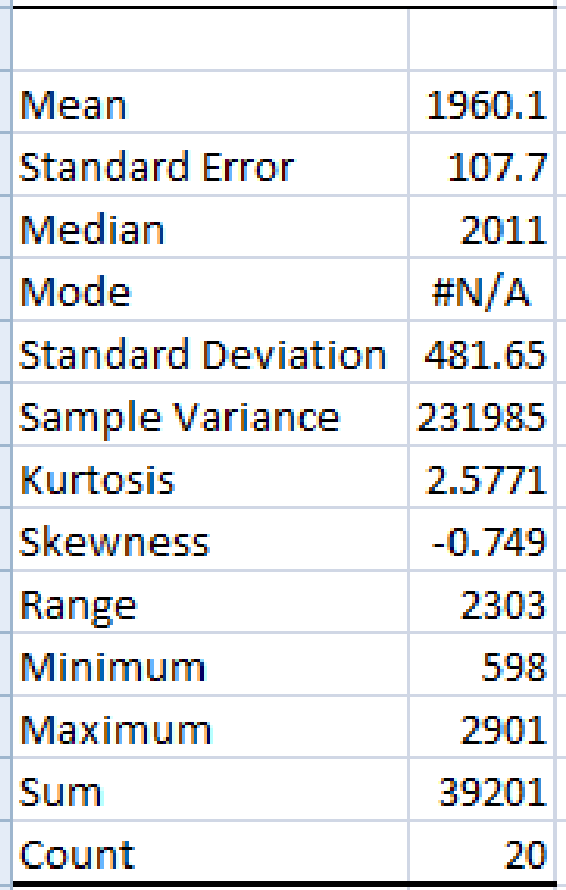
From the EXCEL output, mean is 1,960.1.
Thus, the mean annual advertising expenditure in the automotive sector is 1,960.1.
Department store sector:
Software procedure:
Step by step procedure to obtain the descriptive statistics using EXCEL is as follows:
- In an EXCEL sheet enter the values of second sample and label it as Department store.
- Go to Data > Data Analysis (in case it is not default, take the Analysis ToolPak from Excel Add Ins) > Descriptive statistics.
- Enter Input Range as $B$2:$B$21, select Columns in Grouped By, tick on Summary statistics.
- Click on OK.
Output using EXCEL is given as follows:
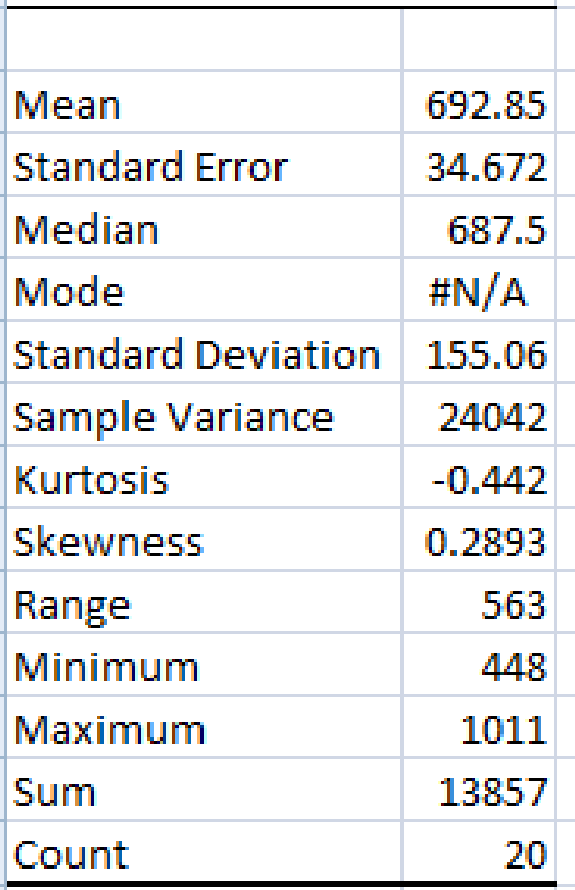
From the EXCEL output, mean is 692.85.
Thus, the mean annual advertising expenditure in the automotive sector is 692.85.
b.
Find the standard deviation for each sector.
Answer to Problem 32E
The standard deviation for annual advertising expenditure in the automotive sector is 481.65.
The standard deviation for annual advertising expenditure in the Department Store is 155.06.
Explanation of Solution
Calculation:
From the EXCEL output obtained in Part (a), the standard deviation for annual advertising expenditure in the automotive sector is 481.65 and the standard deviation for annual advertising expenditure in the Department Store is 155.06.
Thus, the standard deviations for annual advertising expenditure in the automotive sector, and Department store are 481.65, and 155.06, respectively.
c.
Find the range of advertising spent for each sector.
Answer to Problem 32E
The range of annual advertising expenditure in the automotive sector is 2,303.
The range of annual advertising expenditure in the Department Store is 563.
Explanation of Solution
Calculation:
From the EXCEL output obtained in Part (a), the range of annual advertising expenditure in the automotive sector is 2,303 and the range of annual advertising expenditure in the Department Store is 563.
Thus, the range of annual advertising expenditure in the automotive sector, and Department store are 2,303, and 563, respectively.
d.
Find the interquartile range for each sector.
Answer to Problem 32E
The inter quartile range for automotive sector is 525.5.
The inter quartile range for Department Store is 222.5.
Explanation of Solution
Automobile:
The first and third quartiles are obtained for the annual advertising expenditures in the automotive sector.
First quartile:
The EXCEL function to compute first quartile is
Software Procedure:
Step by step procedure to obtain the first quartile using EXCEL is as follows:
- In an EXCEL sheet enter the values of first sample and label it as Automotive.
- In a cell enter the formula QUARTILE.EXC ($A$2:$A$21,1).
- Click on OK.
Output using EXCEL is given as follows:
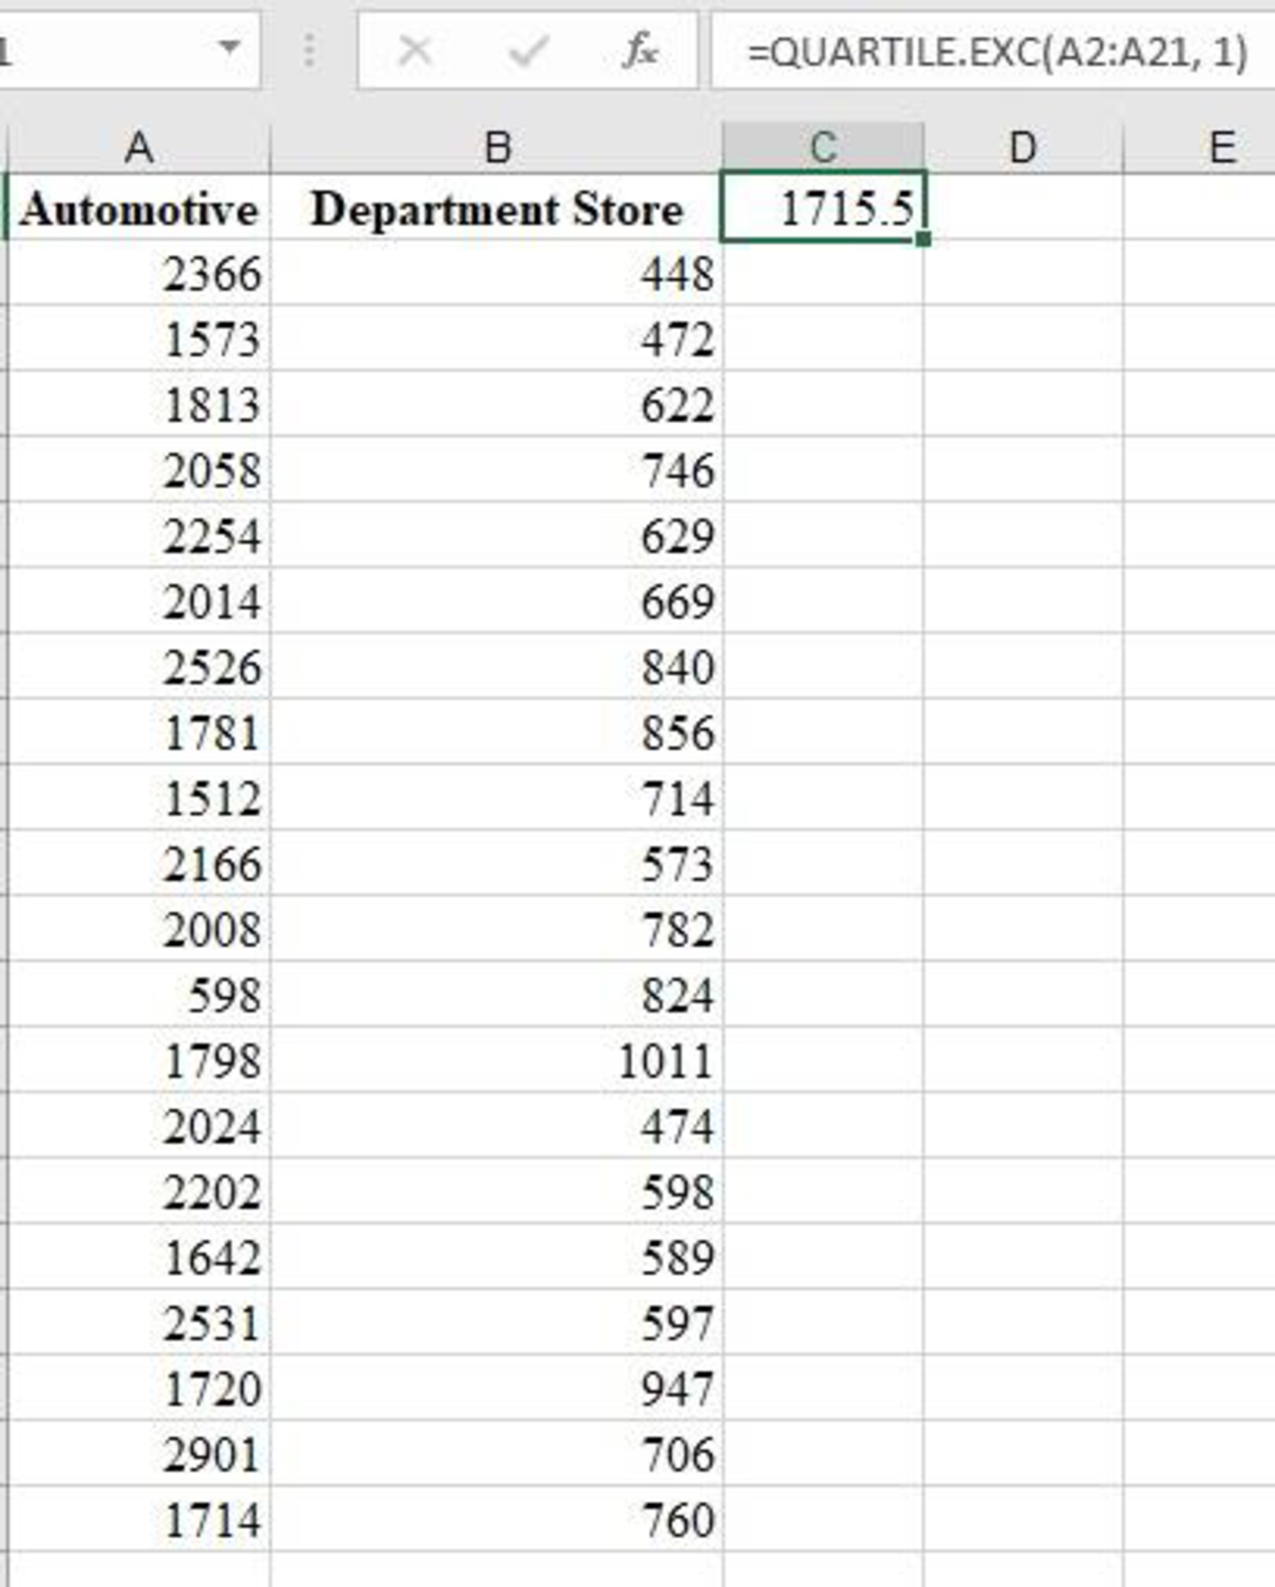
From the EXCEL output, the first quartile of the sample data is 1,715.5.
Third quartile:
The EXCEL function to compute third quartile is
Software Procedure:
Step by step procedure to obtain the third quartile using EXCEL is as follows:
- In an EXCEL sheet enter the values of first sample and label it as Automotive.
- In a cell enter the formula QUARTILE.EXC ($A$2:$A$21,3).
- Click on OK.
Output using EXCEL is given as follows:
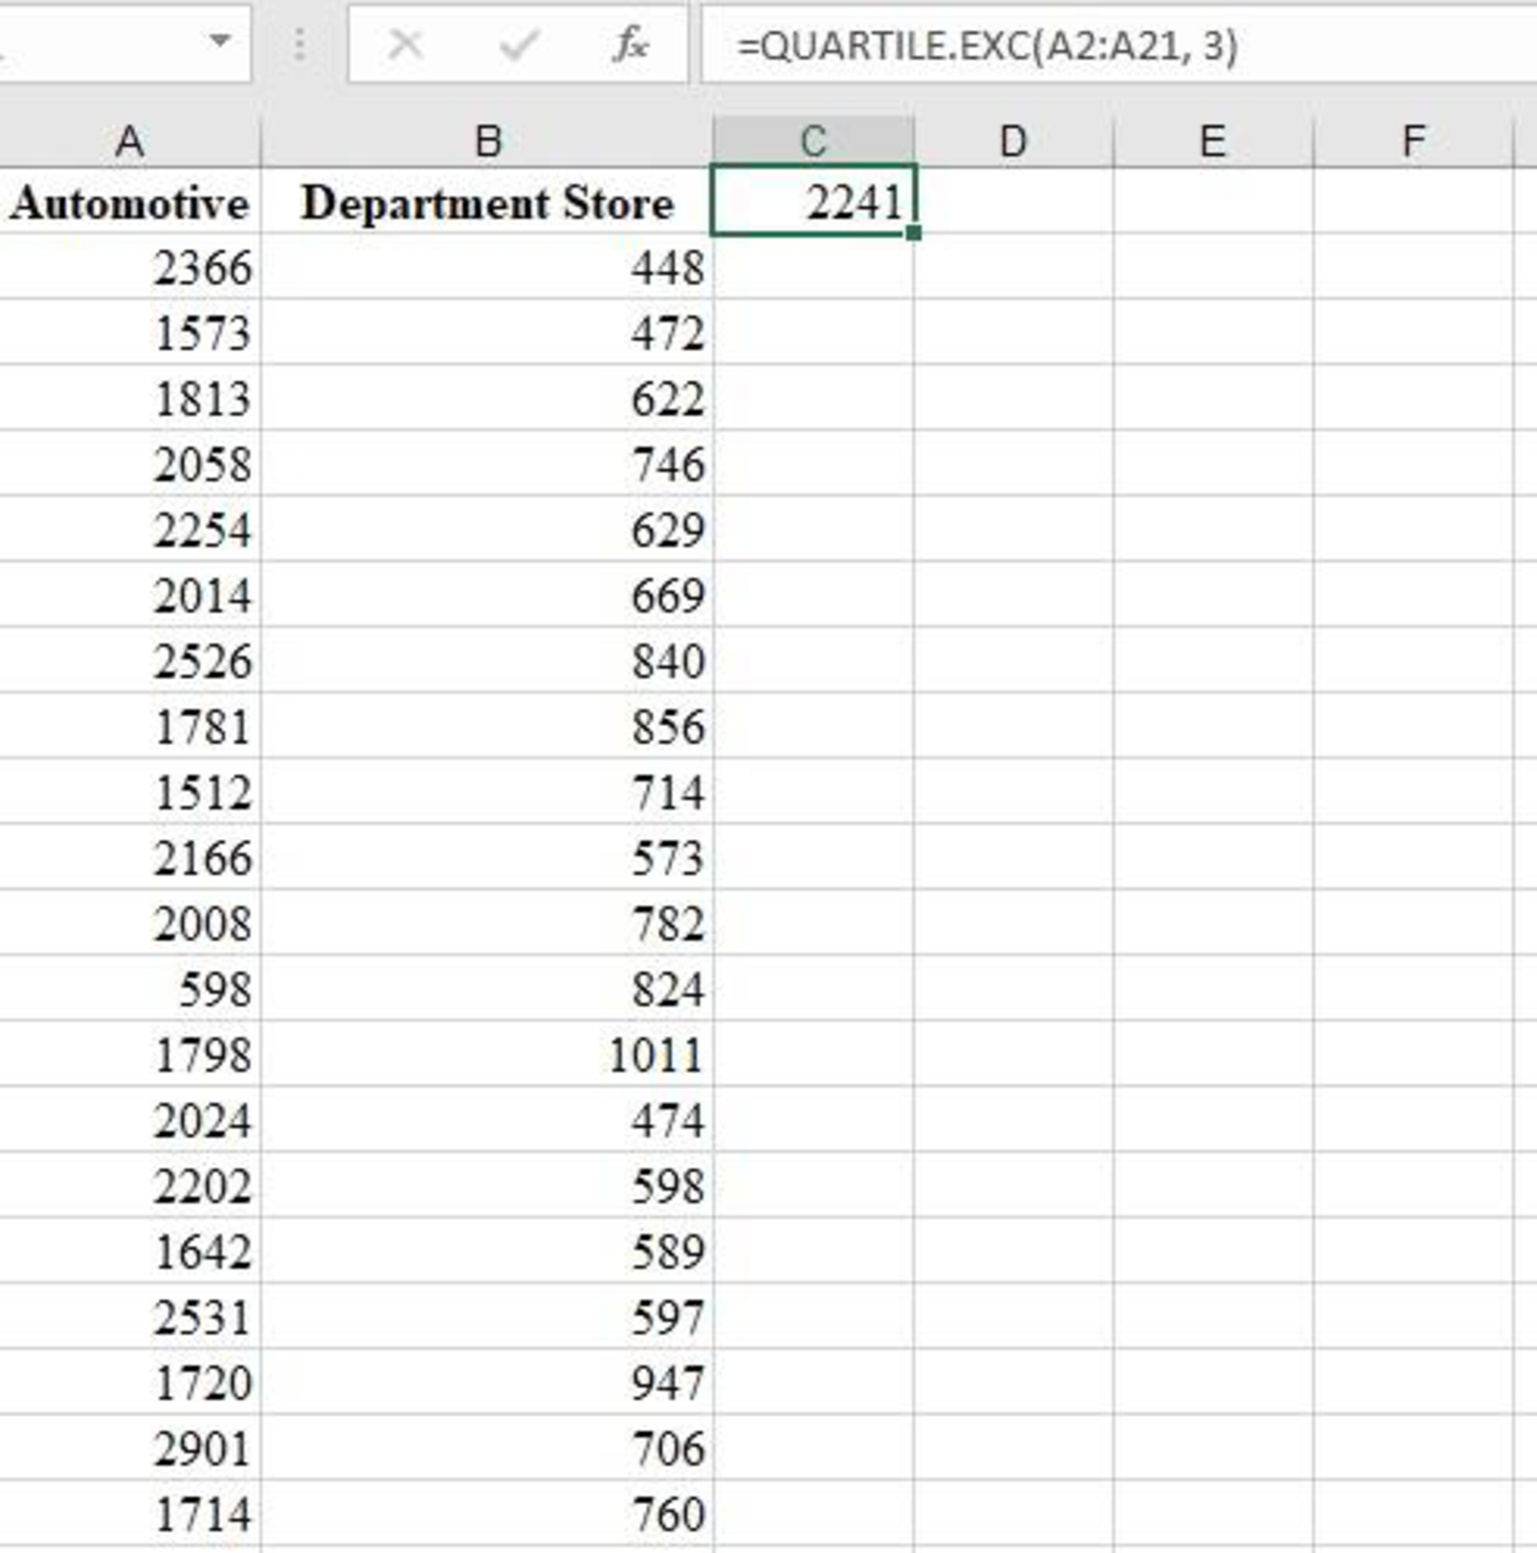
From the EXCEL output, the third quartile of the sample data is 2,241.
The first quartile, and third quartile of the sample data are 1,715.5, and 2,241, respectively.
Inter quartile range:
The first quartile is
The inter quartile range is obtained as given below:
Thus, the inter quartile range for automobile is 525.5.
Department store:
The first and third quartiles are obtained for the annual advertising expenditures in the department store sector.
First quartile:
The EXCEL function to compute first quartile is
Software Procedure:
Step by step procedure to obtain the first quartile using EXCEL is as follows:
- In an EXCEL sheet enter the values of second sample and label it as Department store.
- In a cell enter the formula QUARTILE.EXC ($B$2:$B$21,1).
- Click on OK.
Output using EXCEL is given as follows:
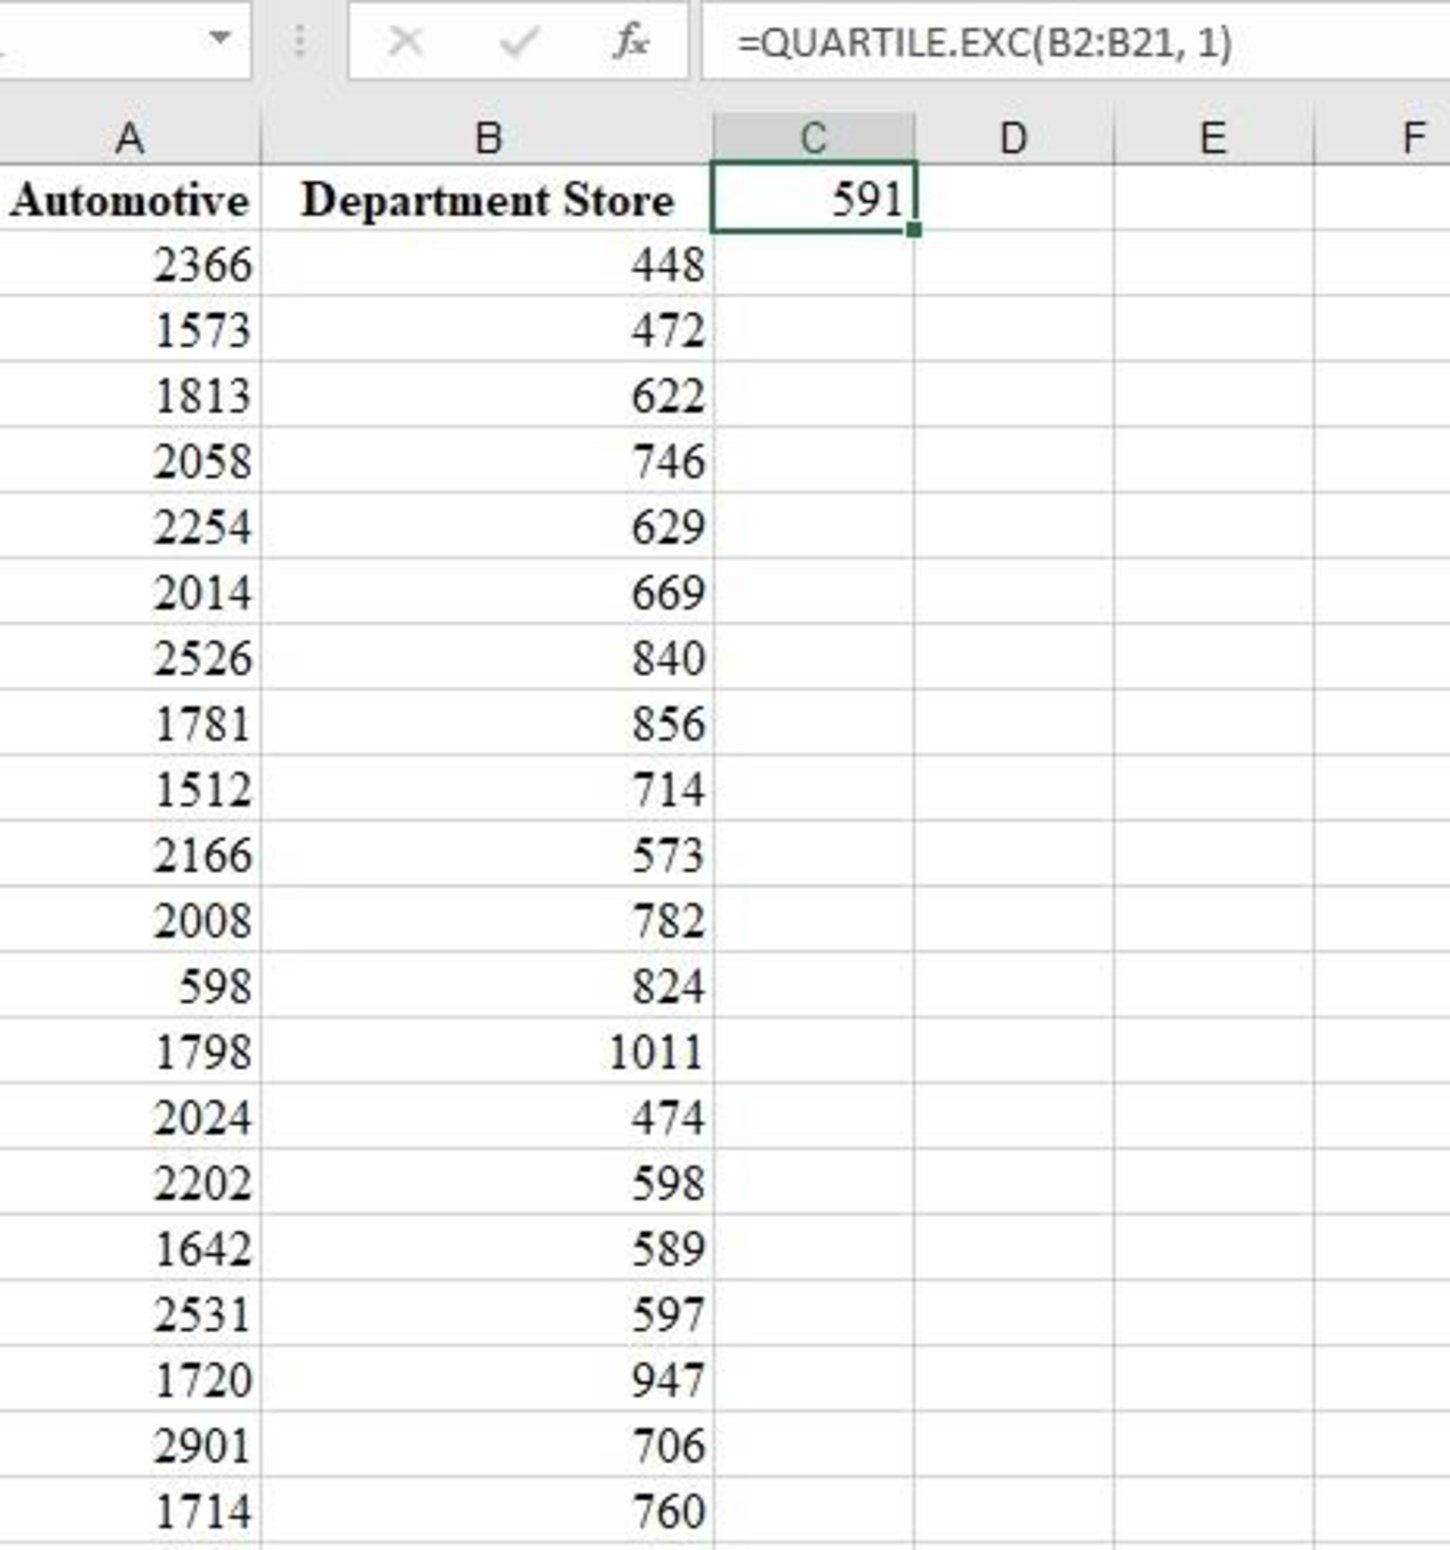
From the EXCEL output, the first quartile of the sample data is 591.
Third quartile:
The EXCEL function to compute third quartile is
Software Procedure:
Step by step procedure to obtain the third quartile using EXCEL is as follows:
- In an EXCEL sheet enter the values of second sample and label it as Department store.
- In a cell enter the formula QUARTILE.EXC ($A$2:$A$21,3).
- Click on OK.
Output using EXCEL is given as follows:
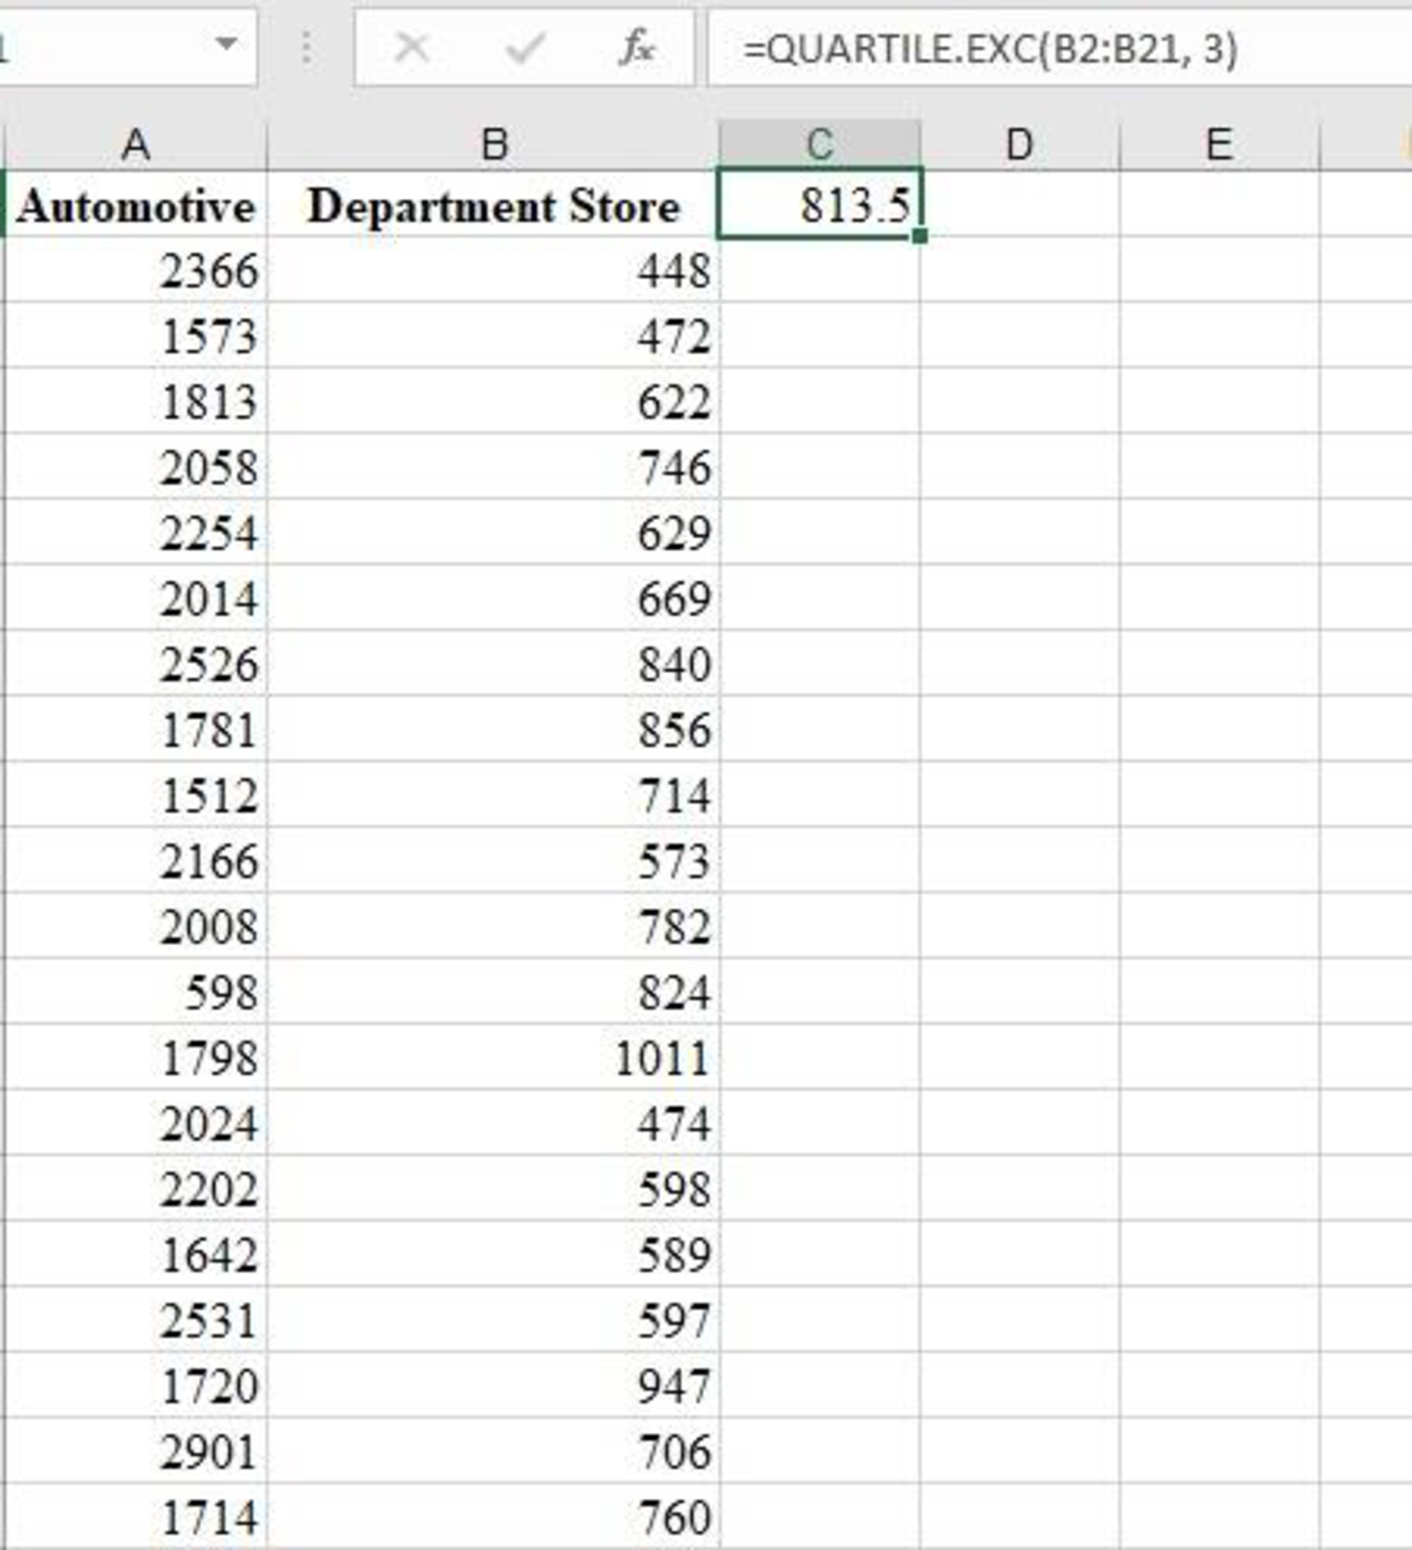
From the EXCEL output, the third quartile of the sample data is 813.5.
The first quartile, and third quartile of the sample data are 591, and 813.5, respectively.
Inter quartile range:
The first quartile is
The inter quartile range is obtained as given below:
Thus, the inter quartile range for automobile is 222.5.
Thus, the interquartile range for automotive and department store are 525.5, and 222.5, respectively.
e.
Comment on any differences in the advertising spending in the automotive companies versus the department store companies.
Explanation of Solution
The mean, standard deviation, range, and inter quartile range for annual advertising expenditure in the automotive sector are 1,960, 482, 2,303, and 525.5, respectively.
The mean, standard deviation, range, and inter quartile range for annual advertising expenditure in the department store sector are 692.85, 155.06, 563, and 222.5, respectively.
All the values of mean, standard deviation, range, and inter quartile range are higher for the annual advertising expenditure in the automotive sector than the annual advertising expenditure in the department store sector.
From this it is known that, automotive spends more money on advertising.
Want to see more full solutions like this?
Chapter 3 Solutions
Modern Business Statistics with Microsoft Office Excel (with XLSTAT Education Edition Printed Access Card) (MindTap Course List)


 Glencoe Algebra 1, Student Edition, 9780079039897...AlgebraISBN:9780079039897Author:CarterPublisher:McGraw Hill