
Modern Business Statistics with Microsoft Office Excel (with XLSTAT Education Edition Printed Access Card) (MindTap Course List)
6th Edition
ISBN: 9781337115186
Author: David R. Anderson, Dennis J. Sweeney, Thomas A. Williams, Jeffrey D. Camm, James J. Cochran
Publisher: Cengage Learning
expand_more
expand_more
format_list_bulleted
Videos
Textbook Question
Chapter 3.4, Problem 51E
Pharmaceutical Company Sales. Annual sales, in millions of dollars, for 21 pharmaceutical companies follow.
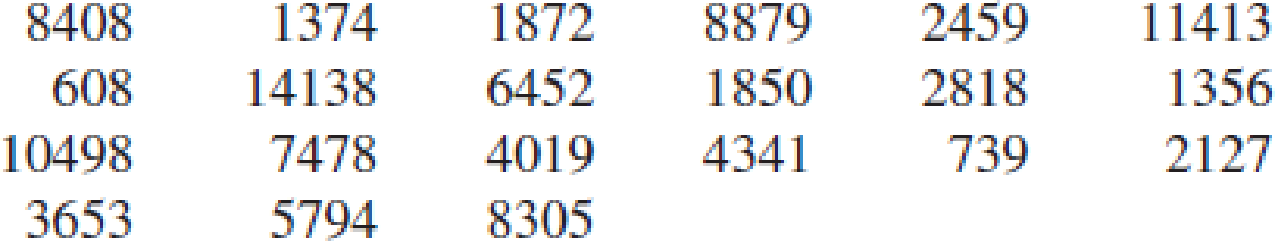
- a. Provide a five-number summary.
- b. Compute the lower and upper limits.
- c. Do the data contain any outliers?
- d. Johnson & Johnson’s sales are the largest on the list at $14,138 million. Suppose a data entry error (a transposition) had been made and the sales had been entered as $41,138 million. Would the method of detecting outliers in part (c) identify this problem and allow for correction of the data entry error?
- e. Show a boxplot.
Expert Solution & Answer
Want to see the full answer?
Check out a sample textbook solution
Students have asked these similar questions
39 students were asked their political orientation and to estimate the number of people making up the US Congress. 16 students identified themselves as conservative, 16 as moderate and 7 as liberal. The following 16 data values represent the estimates of the size of the US Congress for the 16 conservative students.
68
100
162
180
210
230
250
250
260
300
330
440
480
535
535
656
Q1 = 195 and Q3 = 460.
1. For determining outliers, we create an interval to check if all our data is in that interval. What would be the lower endpoint of this interval? ["", "", "", "", ""] AC 0 -125.5 25 68 -202.5
2. For determining outliers, we create an interval to check if all our data is in that interval. What would be the upper endpoint of this interval? ["", "", "", "", ""] AC 857.5 750.5 656 1000 700
3. Finally, what would be our conclusion regarding if there exist any outliers in this data? AC 68 is the only outlier as…
John is interested in the number of children per household for house-holds in Tyler, TX. He conducts several phone interviews and collects the following data:
0
3
2
0
2
1
1
0
6
1
Determine if there are any outliers. How do you know?
The ages of 14 members of a track and field team are given below. Using this data, complete the following steps:
a. Determine the quarries and obtain the five-number summary for the given data.
b. Find the interquartile rage.
c. Calculate the lower and upper limits and identify potential outliers
d. Construct a modified boxplot.
22,24,17,24,25,42,26,24,18,27,25,19,23,26
Chapter 3 Solutions
Modern Business Statistics with Microsoft Office Excel (with XLSTAT Education Edition Printed Access Card) (MindTap Course List)
Ch. 3.1 - 1. Consider a sample with data values of 10, 20,...Ch. 3.1 - 2. Consider a sample with data values of 10, 20,...Ch. 3.1 - 3. Consider the following data and corresponding...Ch. 3.1 - Prob. 4ECh. 3.1 - Prob. 5ECh. 3.1 - Prob. 6ECh. 3.1 - 7. The average number of minutes Americans commute...Ch. 3.1 - Middle-Level Manager Salaries. Suppose that an...Ch. 3.1 - 9. Which companies spend the most money on...Ch. 3.1 - Advertising Spending. Which companies spend the...
Ch. 3.1 - Prob. 11ECh. 3.1 -
The Big Bang Theory, a situation comedy...Ch. 3.1 - Automobile Fuel Efficiencies. In automobile...Ch. 3.1 -
The data contained in the DATAfile named...Ch. 3.1 - 15. Martinez Auto Supplies has retail stores...Ch. 3.1 - 16. The grade point average for college students...Ch. 3.1 - 17. The following table shows the total return and...Ch. 3.1 - 18. Based on a survey of master’s programs in...Ch. 3.1 - Annual revenue for Corning Supplies grew by 5.5%...Ch. 3.1 - Suppose that at the beginning of Year 1 you...Ch. 3.1 - Prob. 21ECh. 3.1 - Prob. 22ECh. 3.2 - 23. Consider a sample with data values of 10, 20,...Ch. 3.2 - Prob. 24ECh. 3.2 - Consider a sample with data values of 27, 25, 20,...Ch. 3.2 - Price of Unleaded Gasoline. Data collected by the...Ch. 3.2 - Round-Trip Flight Prices. The following table...Ch. 3.2 -
The Australian Open is the first of the four...Ch. 3.2 - Air Quality Index. The Los Angeles Times regularly...Ch. 3.2 - Prob. 30ECh. 3.2 -
The results of Accounting Principals’ latest...Ch. 3.2 - Advertising Spend by Companies. Advertising Age...Ch. 3.2 - Scores turned in by an amateur golfer at the...Ch. 3.2 - Consistency of Running Times. The following times...Ch. 3.3 - 35. Consider a sample with data values of 10, 20,...Ch. 3.3 - 36. Consider a sample with a mean of 500 and a...Ch. 3.3 - 37. Consider a sample with a mean of 30 and a...Ch. 3.3 - 38. Suppose the data have a bell-shaped...Ch. 3.3 - 39. The results of a national survey showed that...Ch. 3.3 - 40. The energy information Administration reported...Ch. 3.3 - 41. The Graduate Management Admission Test (GMAT)...Ch. 3.3 - 42. Many families in California are using backyard...Ch. 3.3 -
According to a Los Angeles Times study of more...Ch. 3.3 - NCAA Basketball Game Scores. A sample of 10 NCAA...Ch. 3.3 -
The Wall Street Journal reported that Walmart...Ch. 3.4 - Consider a sample with data values of 27, 25, 20,...Ch. 3.4 - Prob. 47ECh. 3.4 - Prob. 48ECh. 3.4 - Prob. 49ECh. 3.4 - Naples Half-Marathon Times. Naples, Florida, hosts...Ch. 3.4 - Pharmaceutical Company Sales. Annual sales, in...Ch. 3.4 - Cell Phone Companies Customer Satisfaction....Ch. 3.4 - Most Admired Companies. Fortune magazine’s list of...Ch. 3.4 - Prob. 54ECh. 3.5 - Five observations taken for two variables...Ch. 3.5 - Prob. 56ECh. 3.5 - The DATAfile TwoStocks contains adjusted monthly...Ch. 3.5 - Driving Speed and Fuel Efficiency. A department of...Ch. 3.5 - Smoke Detector Use and Death Rates. Over the past...Ch. 3.5 - Stock Market Indexes Comparison. The Russell 1000...Ch. 3.5 - Best Private Colleges. A random sample of 30...Ch. 3 - Americans Dining Out. Americans tend to dine out...Ch. 3 - NCAA Football Coaches Salaries. A 2017 USA Today...Ch. 3 - Physician Office Waiting Times. The average...Ch. 3 - Worker Productivity and Insomnia. U.S. companies...Ch. 3 -
A study of smartphone users shows that 68% of...Ch. 3 - Work Commuting Methods. Public transportation and...Ch. 3 - Household Incomes. The following data represent a...Ch. 3 - Restaurant Chains’ Sales per Store. The data...Ch. 3 - Prob. 70SECh. 3 - NFL Teams Worth. In 2014, the 32 teams in the...Ch. 3 - MLB Team Winning Percentages. Does a major league...Ch. 3 - 73. The days to maturity for a sample of five...Ch. 3 - 74. Automobiles traveling on a road with a posted...Ch. 3 - Annual Returns for Panama Railroad Company Stock....Ch. 3 - Pelican Stores, a division of National Clothing,...Ch. 3 -
The motion picture industry is a competitive...Ch. 3 - The pursuit of a higher education degree in...Ch. 3 - Although millions of elephants once roamed across...
Knowledge Booster


Learn more about
Need a deep-dive on the concept behind this application? Look no further. Learn more about this topic, statistics and related others by exploring similar questions and additional content below.Similar questions
- The area of New Jersey Counties, in square miles, ranges from 47 to 819 with Q1=228, median=329 and Q3=476. The full data set follows. 47 103 130 192 221 228 234 267 307 312 329 362 365 423 468 476 500 527 569 642 819 According to the 1.5 x IQR criterion, are there any potential outliers in the data set? a) Yes b) Noarrow_forwardIdentify all possible outliers from the following data set:0.145.24.756.1517.23.97.8arrow_forwardYou are interested in how many contacts older adults have in their smartphones. Here are data on the number of contacts for a random sample of 30 elderly adults with smartphones in a large city. 7 20 24 25 25 28 28 30 32 35 42 43 44 45 46 47 48 48 50 51 72 75 77 78 79 83 87 88 135 151 Are there any outliers? Enter the boundary for low and high outliers below, then determine if the data set has any outliers. Do not round the boundary values.arrow_forward
- Refer the given table below and identify the indicator that can be used to detect outlier from multiple variables? Also, identify and report how many respondents have outliers in the given table? Respondents Mahalanobis Distance Value Mahalanobis Chi- Square Significance Z-Score Value Mean Value 80 75.159 0.0001 3.24 2.083 339 74.737 0.0042 3.29 2.681 82 73.711 0.0012 4.56 3.452 278 73.429 0.0201 2.98 5.698 172 71.093 0.0003 -3.29 6.321 35 69.442 0.0128 6.32 2.314arrow_forwardProfessor Moore is interested in examining the commute times of her students to class.. Here is a sample of daily commute times (in minutes) of 42 students. 24 30 20 60 15 25 15 25 34 12 25 5 25 35 40 20 17 30 25 25 25 20 45 15 30 6 4 4 25 20 15 15 3 20 10 15 15 10 7 18 22 6 A. Are there any outliers? Show your calculations.arrow_forwardHere are the scores of 10 students in an introductory statistics course: 55 74 75 81 83 85 92 93 93 97 Find the interquartile range and use the 1.5 x IQR rule to check for outliers. How low would the lowest score need to be for it to be an outlier according to the rule?arrow_forward
- The following data represent salaries, in thousands of dollars, for employees of a small company. Find and state the five number summary, and use it to determine if any values are outliers. 24 25 25 27 27 29 30 35 35 35 36 38 38 39 39 40 40 40 45 45 45 45 47 52 52 52 58 59 59 61 61 67 68 68 68 250arrow_forwardThe set of data represents the annual consumption of soft drinks, in litres, by 20 families.212 185 68 267 450 349 618 320 278 348410 332 311 256 302 345 287 508 426 510a) Determine the interquartile range . b) Are there any outliers?arrow_forwardHow many outliers would be considered in this data? Something is wrong with my lower and upper formulas City Median Household Income Morgantown, WV $ 38,060 Fayetteville, AR $ 40,835 Wooster, OH $ 43,054 max $ 138,192.00 =MAX(B:B) Council Bluffs, IA $ 46,844 min $ 38,060.00 =MIN(B:B) Bossier City, LA $ 47,051 mean $ 72,342.94 =AVERAGE(B:B) St. Augustine, FL $ 47,748 median $ 66,743.00 =MEDIAN(B:B) Rapid City, SD $ 47,788 range $ 100,132.00 =E4-E5 Bozeman, MT $ 49,303 std deviation $ 23,711.80 =STDEV.S(B:B) Sparks, NV $ 54,230 first quartile $…arrow_forward
- Determine whether the data has any outliers. If so, how many? Show your calculation or provide a detailed explanation on how you reached this conclusion. 15 12 6.2 7 5.5 2 4 5 10 11 7 6 4 7 01 5 3.2 4 10 6 2 10 1.5 5.1 6.4 8 14 3 2arrow_forwardThe commute times (in minutes) of 30 employees are listed below 31 41 45 48 52 55 56 55 63 65 67 67 69 70 70 74 75 78 79 79 80 81 83 85 85 87 90 92 95 99 a) what is the lower bound? b) what is the lower bound? c) Are there any outliers and explain whyarrow_forwardThe five-number summary of the passengers on a cruise ship is listed below. Min Q1 Median Q3 Max 1 20 29 38 80 Consider the following two statements regarding outliers for this data and determine which, if any, are correct. (i) There is at least one passenger whose age is a low outlier. (ii) There is at least one passenger whose age is a high outlier. A. Neither statement (i) nor (ii) is correct. B. Both statements (i) and (ii) are correct. C. Only statement (i) is correct. D. Only statement (ii) is correct. ( don't Hand writing solution)arrow_forward
arrow_back_ios
SEE MORE QUESTIONS
arrow_forward_ios
Recommended textbooks for you
 Glencoe Algebra 1, Student Edition, 9780079039897...AlgebraISBN:9780079039897Author:CarterPublisher:McGraw Hill
Glencoe Algebra 1, Student Edition, 9780079039897...
Algebra
ISBN:9780079039897
Author:Carter
Publisher:McGraw Hill
Hypothesis Testing using Confidence Interval Approach; Author: BUM2413 Applied Statistics UMP;https://www.youtube.com/watch?v=Hq1l3e9pLyY;License: Standard YouTube License, CC-BY
Hypothesis Testing - Difference of Two Means - Student's -Distribution & Normal Distribution; Author: The Organic Chemistry Tutor;https://www.youtube.com/watch?v=UcZwyzwWU7o;License: Standard Youtube License