
Modern Business Statistics with Microsoft Office Excel (with XLSTAT Education Edition Printed Access Card) (MindTap Course List)
6th Edition
ISBN: 9781337115186
Author: David R. Anderson, Dennis J. Sweeney, Thomas A. Williams, Jeffrey D. Camm, James J. Cochran
Publisher: Cengage Learning
expand_more
expand_more
format_list_bulleted
Videos
Textbook Question
Chapter 3.1, Problem 12E
The Big Bang Theory, a situation comedy featuring Johnny Galecki, Jim Parsons, and Kaley Cuoco, is one of the most watched programs on network television. The first two episodes for the 2011–2012 season premiered on September 22, 2011; the first episode attracted 14.1 million viewers and the second episode attracted 14.7 million viewers. The
Following table shows the number of viewers in millions for the first 21 episodes of the 2011–2012 season (The Big Bang Theory website. April 17. 2012).
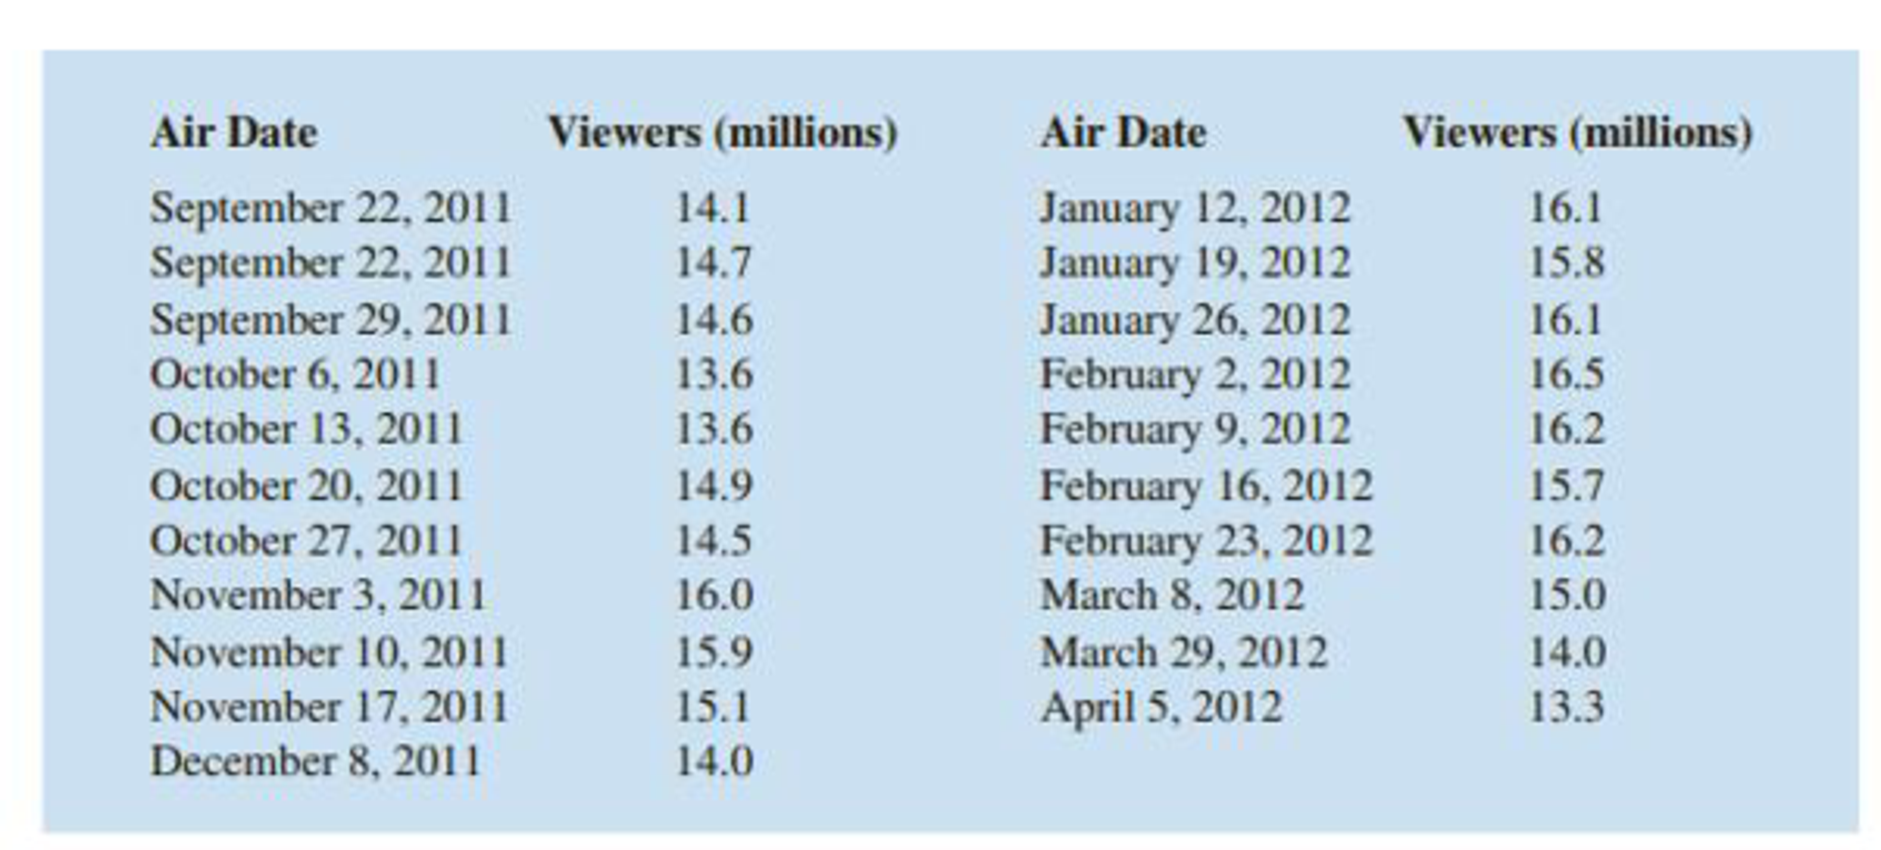
- a. Compute the minimum and maximum number of viewers.
- b. Compute the
mean , median, andmode . - c. Compute the first and third quartiles.
- d. Has viewership grown or declined over the 2011–2012 season? Discuss.
Expert Solution & Answer

Trending nowThis is a popular solution!

Students have asked these similar questions
Subject: Stochastic process
Question 1 is attached to the image section below
Can you explain the Chebyshev's Theory?
What would be my research hypothesis for this scenario?
Chapter 3 Solutions
Modern Business Statistics with Microsoft Office Excel (with XLSTAT Education Edition Printed Access Card) (MindTap Course List)
Ch. 3.1 - 1. Consider a sample with data values of 10, 20,...Ch. 3.1 - 2. Consider a sample with data values of 10, 20,...Ch. 3.1 - 3. Consider the following data and corresponding...Ch. 3.1 - Prob. 4ECh. 3.1 - Prob. 5ECh. 3.1 - Prob. 6ECh. 3.1 - 7. The average number of minutes Americans commute...Ch. 3.1 - Middle-Level Manager Salaries. Suppose that an...Ch. 3.1 - 9. Which companies spend the most money on...Ch. 3.1 - Advertising Spending. Which companies spend the...
Ch. 3.1 - Prob. 11ECh. 3.1 -
The Big Bang Theory, a situation comedy...Ch. 3.1 - Automobile Fuel Efficiencies. In automobile...Ch. 3.1 -
The data contained in the DATAfile named...Ch. 3.1 - 15. Martinez Auto Supplies has retail stores...Ch. 3.1 - 16. The grade point average for college students...Ch. 3.1 - 17. The following table shows the total return and...Ch. 3.1 - 18. Based on a survey of master’s programs in...Ch. 3.1 - Annual revenue for Corning Supplies grew by 5.5%...Ch. 3.1 - Suppose that at the beginning of Year 1 you...Ch. 3.1 - Prob. 21ECh. 3.1 - Prob. 22ECh. 3.2 - 23. Consider a sample with data values of 10, 20,...Ch. 3.2 - Prob. 24ECh. 3.2 - Consider a sample with data values of 27, 25, 20,...Ch. 3.2 - Price of Unleaded Gasoline. Data collected by the...Ch. 3.2 - Round-Trip Flight Prices. The following table...Ch. 3.2 -
The Australian Open is the first of the four...Ch. 3.2 - Air Quality Index. The Los Angeles Times regularly...Ch. 3.2 - Prob. 30ECh. 3.2 -
The results of Accounting Principals’ latest...Ch. 3.2 - Advertising Spend by Companies. Advertising Age...Ch. 3.2 - Scores turned in by an amateur golfer at the...Ch. 3.2 - Consistency of Running Times. The following times...Ch. 3.3 - 35. Consider a sample with data values of 10, 20,...Ch. 3.3 - 36. Consider a sample with a mean of 500 and a...Ch. 3.3 - 37. Consider a sample with a mean of 30 and a...Ch. 3.3 - 38. Suppose the data have a bell-shaped...Ch. 3.3 - 39. The results of a national survey showed that...Ch. 3.3 - 40. The energy information Administration reported...Ch. 3.3 - 41. The Graduate Management Admission Test (GMAT)...Ch. 3.3 - 42. Many families in California are using backyard...Ch. 3.3 -
According to a Los Angeles Times study of more...Ch. 3.3 - NCAA Basketball Game Scores. A sample of 10 NCAA...Ch. 3.3 -
The Wall Street Journal reported that Walmart...Ch. 3.4 - Consider a sample with data values of 27, 25, 20,...Ch. 3.4 - Prob. 47ECh. 3.4 - Prob. 48ECh. 3.4 - Prob. 49ECh. 3.4 - Naples Half-Marathon Times. Naples, Florida, hosts...Ch. 3.4 - Pharmaceutical Company Sales. Annual sales, in...Ch. 3.4 - Cell Phone Companies Customer Satisfaction....Ch. 3.4 - Most Admired Companies. Fortune magazine’s list of...Ch. 3.4 - Prob. 54ECh. 3.5 - Five observations taken for two variables...Ch. 3.5 - Prob. 56ECh. 3.5 - The DATAfile TwoStocks contains adjusted monthly...Ch. 3.5 - Driving Speed and Fuel Efficiency. A department of...Ch. 3.5 - Smoke Detector Use and Death Rates. Over the past...Ch. 3.5 - Stock Market Indexes Comparison. The Russell 1000...Ch. 3.5 - Best Private Colleges. A random sample of 30...Ch. 3 - Americans Dining Out. Americans tend to dine out...Ch. 3 - NCAA Football Coaches Salaries. A 2017 USA Today...Ch. 3 - Physician Office Waiting Times. The average...Ch. 3 - Worker Productivity and Insomnia. U.S. companies...Ch. 3 -
A study of smartphone users shows that 68% of...Ch. 3 - Work Commuting Methods. Public transportation and...Ch. 3 - Household Incomes. The following data represent a...Ch. 3 - Restaurant Chains’ Sales per Store. The data...Ch. 3 - Prob. 70SECh. 3 - NFL Teams Worth. In 2014, the 32 teams in the...Ch. 3 - MLB Team Winning Percentages. Does a major league...Ch. 3 - 73. The days to maturity for a sample of five...Ch. 3 - 74. Automobiles traveling on a road with a posted...Ch. 3 - Annual Returns for Panama Railroad Company Stock....Ch. 3 - Pelican Stores, a division of National Clothing,...Ch. 3 -
The motion picture industry is a competitive...Ch. 3 - The pursuit of a higher education degree in...Ch. 3 - Although millions of elephants once roamed across...
Knowledge Booster


Learn more about
Need a deep-dive on the concept behind this application? Look no further. Learn more about this topic, statistics and related others by exploring similar questions and additional content below.Similar questions
- For 25 years, Arthur Reynolds and Judy Temple tracked more than 1,400 children who participated in a publicly funded early childhood development program beginning at age 3. They found that children who participated in the program showed higher levels of educational attainment, socioeconomic status, and job skills, as well as lower rates of substance abuse, felony arrest, and incarceration, than those who did not receive school-based early education. One possible theory for the success of this program is that improving school readiness improved the children's success in school. The improved success in school in turn improved their readiness for adulthood, resulting in increased job skills and socioeconomic status as well as lower rates of substance abuse.arrow_forwardFor 25 years, Arthur Reynolds and Judy Temple tracked more than 1,400 children who participated in a publicly funded early childhood development program beginning at age 3. They found that children who participated in the program showed higher levels of educational attainment, socioeconomic status, and job skills, as well as lower rates of substance abuse, felony arrest, and incarceration, than those who did not receive school-based early education. One possible theory for the success of this program is that improving school readiness improved the children's success in school. The improved success in school in turn improved their readiness for adulthood, resulting in increased job skills and socioeconomic status as well as lower rates of substance abuse. What is the independent and dependent variable?arrow_forwardb) What are the three models proposed as extensions of the GARCH model? Describe their advantages over the GARCH.arrow_forward
- Assume the chances of failure of each component is given in Figure. What is the probability that the system would not work? .arrow_forwardSI jinx Players in any sport who are having greatseasons, turning in performances that are much betterthan anyone might have anticipated, often are picturedon the cover of Sports Illustrated. Frequently, their performances then falter somewhat, leading some ath-letes to believe in a “Sports Illustrated jinx.” Similarly, it is common for phenomenal rookies to have less stel-lar second seasons—the so-called “sophomore slump.” While fans, athletes, and analysts have proposed many theories about what leads to such declines, a statisti-cian might offer a simpler (statistical) explanation. Explain.arrow_forwardIn the Chernobyl nuclear accident it is estimated that 30,000 people received an average dose of 45 REM. For this population, using the linear hypothesis, how many "normal" deaths from cancer are expected and how many additional deaths from the radiation of the accident? Group of answer choices 500 normal, 6000 additional 1000 normal, 4000 additional 2000 normal, 3000 additional 4000 normal, 1000 additional 6000 normal, 500 additionalarrow_forward
- A sociologist recorded the number of contacts entered in a cell phone and the number of texts sent in a week for 20 cell phone users. The resulting data were used to conduct a hypothesis test to investigate whether there is a linear relationship between the number of contacts and the number of texts sent. What are the correct hypotheses for the test? H0:β1=0Ha:β1≠0H0:β1=0Ha:β1≠0 A H0:β1=0Ha:β1>0H0:β1=0Ha:β1>0 B H0:β1=0Ha:β1<0H0:β1=0Ha:β1<0 C H0:β1≠0Ha:β1=0H0:β1≠0Ha:β1=0 D H0:b1=0Ha:b1≠0 Earrow_forwardWhich of the following is an advantage of qualitative research? Select an answer and submit. For keyboard navigation, use the up/down arrow keys to select an answer. a It is well-suited for exploring hidden reasons behind complex, interrelated, or multifaceted social processes. b It is often helpful for theory construction in areas with no or insufficient a priori theory. c It is appropriate for studying context-specific, unique, or idiosyncratic events or processes. d All of the abovearrow_forwardConsider the following payoff matrix.arrow_forward
- The table below shows the number of deaths in the U.S. in a year due to a variety of causes. For these questions, assume these values are not changing from year to year, and that the population of the United States is 312 million people. Cause Deaths Passenger car occupant 13,100 Motorcycle driver 4,500 Tornado 553 Skydiving 56 h) People sometimes claim motorcycle riding is less dangerous than driving. Does the data support this claim? What additional information and/or calculations would be useful to evaluate this claim?arrow_forwardConsider the hypothetical case that there were only two brands of juice on the market, company A and company B. 52% of the population drinks juice from company A (it is not known whether these people consume only juice A or if they also consume juice B). 51% of the population drinks juice of company B (again, it is not known how many of these people drink only juice B or if they drink both juice). However, it is known that 21% of the population does not drink juice. Based on these data, we can estimate that the percentage of the population that drinks juice from both companies is: (choose only one): a) 36% b)37% c) 24% d)23% e)5.3%arrow_forward1. A researcher observed a rat respond for a food reward by pressing one of the three levers in a cage. Pressing the lever to the right (R) produced no food reward. pressing the lever to the left (L) produced a single food pellet, and pressing the lever at the center (C) produced two food pellets. Because the center level produced the largest reward, the researcher hypothesized that the rat would press this lever most often. Each trial ended when the rat produced a level. The researcher recorded lever pressing for 30 trials. L, L, R, L, R, C, R, L, C, L, L, C, C, C, R, C, R, C, L, C, C, L, C, C, C, L, C, C, C, C, C - Create the appropiate graph for this data - Do these data support the hypothesis? Explain. 2. Which scales of measurement are assumed to be discrete? What does this mean? Which scales of measurement are assumed to be continuous? What does this mean? 3. What type of graph should you create to visualize the following frequency data? Explain. -…arrow_forward
arrow_back_ios
SEE MORE QUESTIONS
arrow_forward_ios
Recommended textbooks for you
 MATLAB: An Introduction with ApplicationsStatisticsISBN:9781119256830Author:Amos GilatPublisher:John Wiley & Sons Inc
 Probability and Statistics for Engineering and th...StatisticsISBN:9781305251809Author:Jay L. DevorePublisher:Cengage Learning
 Statistics for The Behavioral Sciences (MindTap C...StatisticsISBN:9781305504912Author:Frederick J Gravetter, Larry B. WallnauPublisher:Cengage Learning
 Elementary Statistics: Picturing the World (7th E...StatisticsISBN:9780134683416Author:Ron Larson, Betsy FarberPublisher:PEARSON
 The Basic Practice of StatisticsStatisticsISBN:9781319042578Author:David S. Moore, William I. Notz, Michael A. FlignerPublisher:W. H. Freeman
 Introduction to the Practice of StatisticsStatisticsISBN:9781319013387Author:David S. Moore, George P. McCabe, Bruce A. CraigPublisher:W. H. Freeman
MATLAB: An Introduction with Applications
Statistics
ISBN:9781119256830
Author:Amos Gilat
Publisher:John Wiley & Sons Inc
Probability and Statistics for Engineering and th...
Statistics
ISBN:9781305251809
Author:Jay L. Devore
Publisher:Cengage Learning
Statistics for The Behavioral Sciences (MindTap C...
Statistics
ISBN:9781305504912
Author:Frederick J Gravetter, Larry B. Wallnau
Publisher:Cengage Learning
Elementary Statistics: Picturing the World (7th E...
Statistics
ISBN:9780134683416
Author:Ron Larson, Betsy Farber
Publisher:PEARSON
The Basic Practice of Statistics
Statistics
ISBN:9781319042578
Author:David S. Moore, William I. Notz, Michael A. Fligner
Publisher:W. H. Freeman
Introduction to the Practice of Statistics
Statistics
ISBN:9781319013387
Author:David S. Moore, George P. McCabe, Bruce A. Craig
Publisher:W. H. Freeman
what is Research Design, Research Design Types, and Research Design Methods; Author: Educational Hub;https://www.youtube.com/watch?v=LpmGSioXxdo;License: Standard YouTube License, CC-BY