
Videos
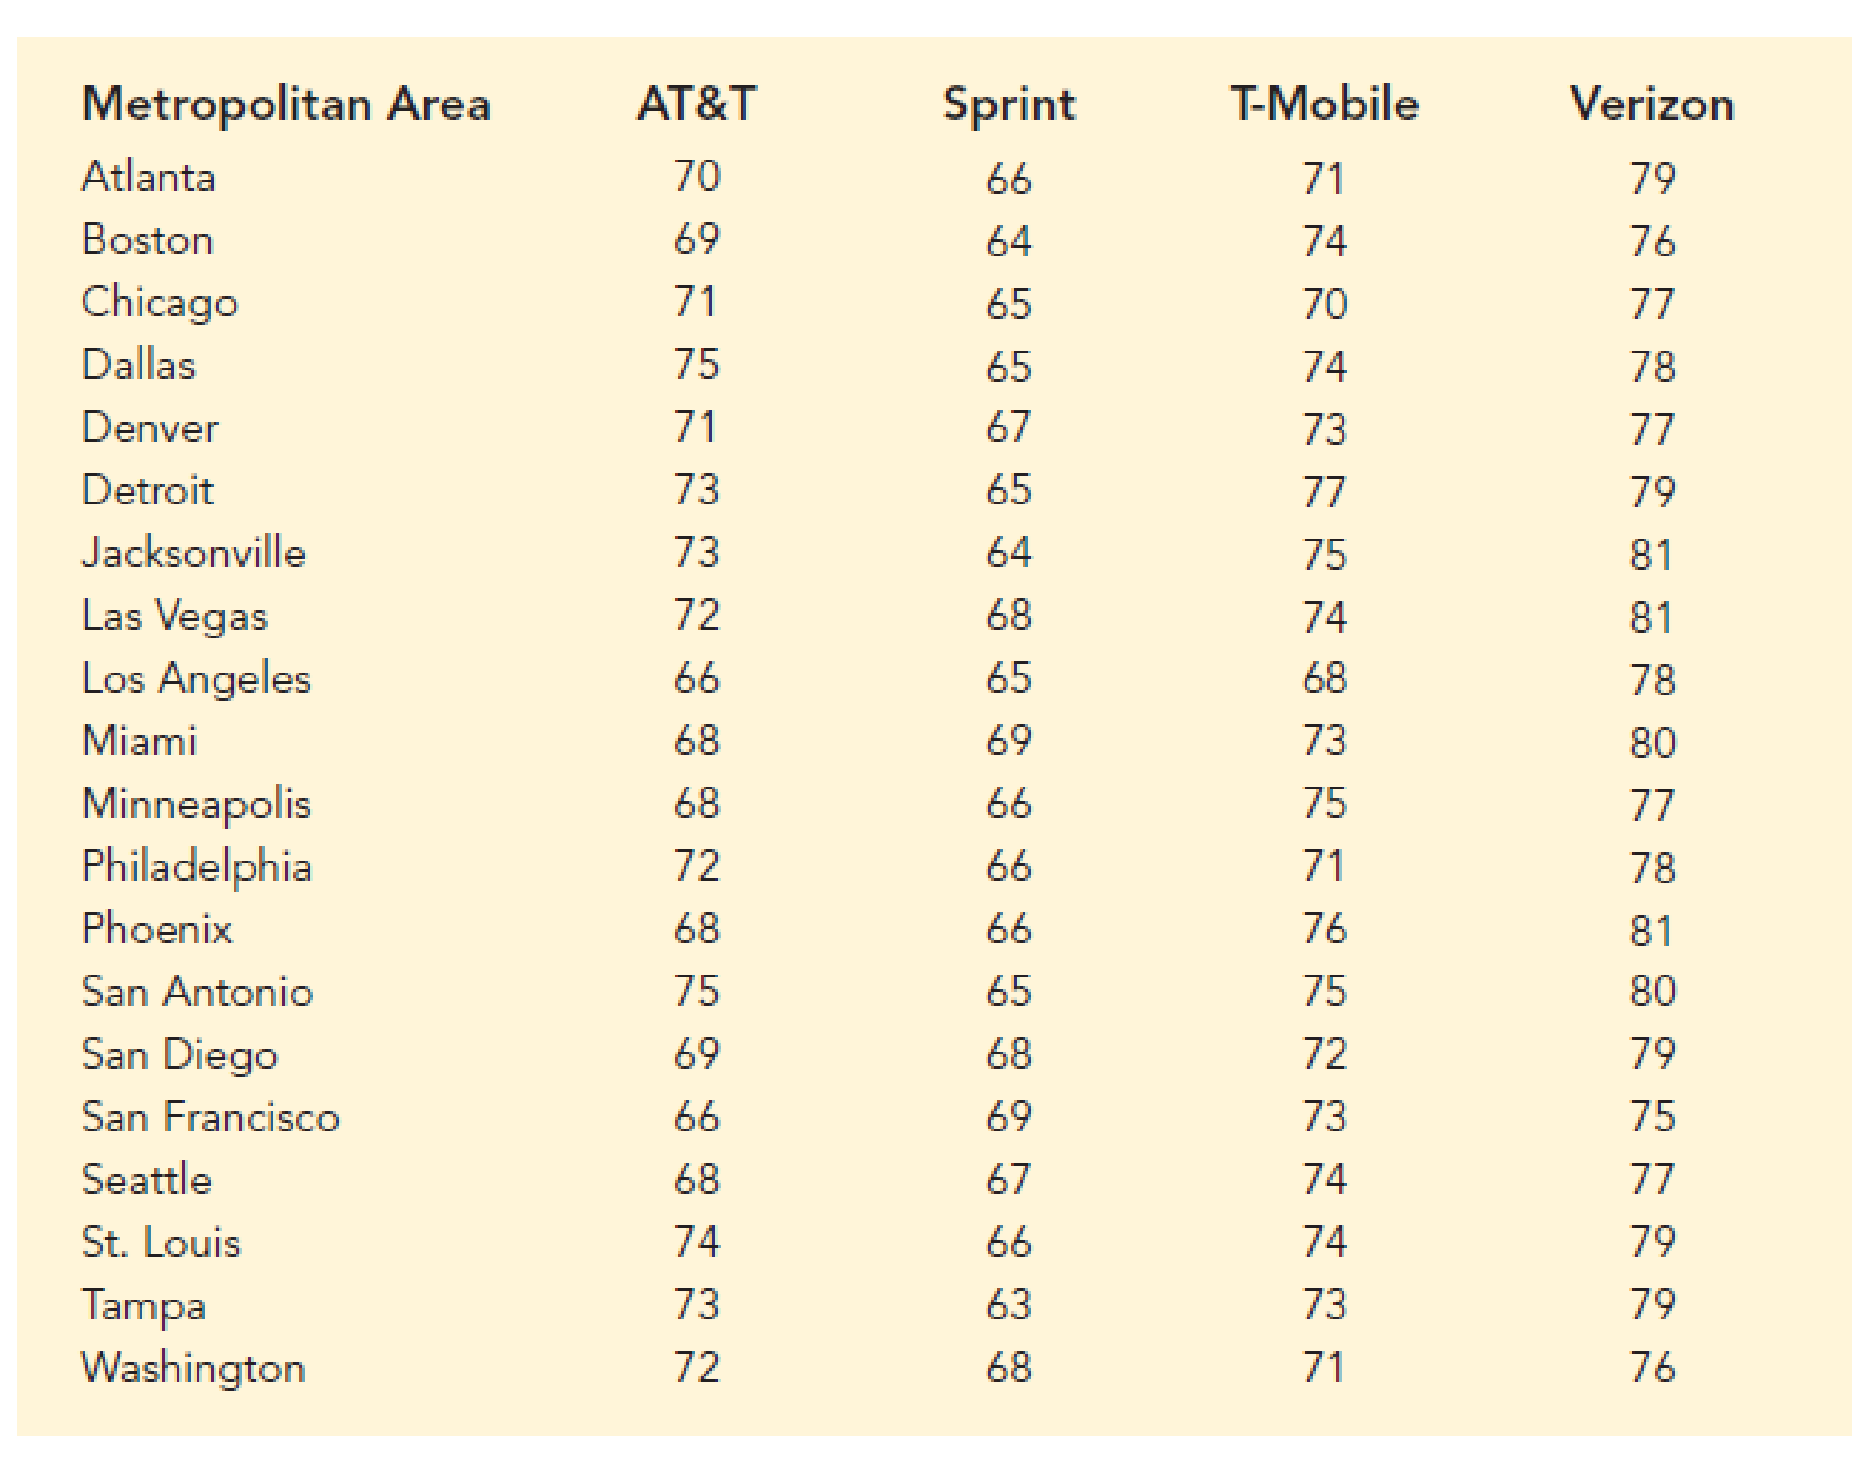
Cell Phone Companies Customer Satisfaction. Consumer Reports provides overall customer satisfaction scores for AT&T, Sprint, T-Mobile, and Verizon cell-phone services in major metropolitan areas throughout the United States. The rating for each service reflects the overall customer satisfaction considering a variety of factors such as cost, connectivity problems, dropped calls, static interference, and customer support. A satisfaction scale from 0 to 100 is used with 0 indicating completely dissatisfied and 100 indicating completely satisfied. Suppose that the ratings for the four cell-phone services in 20 metropolitan areas are as shown below.
- a. Consider T-Mobile first. What is the median rating?
- b. Develop a five-number summary for the T-Mobile service.
- c. Are there outliers for T-Mobile? Explain.
- d. Repeat parts (b) and (c) for the other three cell-phone services.
- e. Show the boxplots for the four cell-phone services on one graph. Discuss what a comparison of the boxplots tells about the four services. Which service does Consumer Reports recommend as being best in terms of overall customer satisfaction?
Want to see the full answer?
Check out a sample textbook solution
Chapter 3 Solutions
Modern Business Statistics with Microsoft Office Excel (with XLSTAT Education Edition Printed Access Card) (MindTap Course List)


- A quality control engineer studied the relationship between years of experience as a system control engineer and the capacity of the engineer to complete within a given time a complex control design including the debugging of all computer programs and control devices. A group of 25 engineers having widely differing amounts of experience (measured in months of experience) was given the same control design project. The results of the study are given in the following table with y = 1 if the project was successfully completed in the allocated time and y = 0 if the project was not successfully completed. a. Determine whether experience is associated with the probability of completingthe task. b. Compute the probability of successfully completing the task for an engineer having 24 months of experience. Place a 95% confidence interval on your estimate.arrow_forwardCreate a two-way table for the variables Eye Color and Organ Donors. What percentage of organ donors have green eyes? What percentage of non-donors have brown eyes? What percentage of blue-eyed students are organ donors? Hz Bro Bro Blu Hz Bro Bro Bro Bro Bro Blu Bro Hz Gr Blu Bro Gr Blu Bro Bro N Y Y N N Y N N Y N Y Y Y Y Y Y N N Y Yarrow_forwardIn the Focus Problem at the beginning of this chapter, a study was described comparing the hatch ratios of wood duck nesting boxes. Group I nesting boxes were well separated from each other and well hidden by available brush. There were a total of 489 eggs in group I boxes, of which a field count showed about 272 hatched. Group II nesting boxes were placed in highly visible locations and grouped closely together. There were a total of 821 eggs in group II boxes, of which a field count showed about 262 hatched. (a) Find a point estimate p̂1 for p1, the proportion of eggs that hatch in group I nest box placements. (Round your answer to four decimal places.) p̂1 = Find a 95% confidence interval for p1. (Round your answers to three decimal places.) lower limitupper limit (b) Find a point estimate p̂2 for p2, the proportion of eggs that hatch in group II nest box placements. (Round your answer to four decimal places.) p̂2 = Find a 95% confidence interval for p2. (Round your…arrow_forward
- Refer to the data file P08_63.xlsx. SoftBus Company sells PC equipment and customized software to small companies to help them manage their day-to-day business activities. Although SoftBus spends time with all customers to understand their needs, the customers are eventually on their own to use the equipment and software intelligently. To understand its customers better, SoftBus recently sent questionnaires to a large number of prospective customers. Key personnel—those who would be using the software—were asked to fill out the questionnaire. SoftBus received 82 usable responses, as shown in the file. You can assume that these employees represent a random sample of all of SoftBus's prospective customers. SoftBus believes it can afford to spend much less time with customers who own PCs and score at least 4 on PC Knowledge. Let's call these the "PC-savvy" customers. On the other hand, SoftBus believes it will have to spend a lot of time with customers who do not own a PC and score 2 or…arrow_forwardCity Hotel Room Rate ($) Entertainment ($) Boston 144 161 Denver 96 103 Nashville 88 103 New Orleans 112 143 Phoenix 89 100 San Diego 100 119 San Francisco 137 166 San Jose 93 138 Tampa 86 99 Concur Technologies, Inc., is a large expense-management company located in Redmond, Washington. The Wall Street Journal asked Concur to examine the data from 8.3 million expense reports to provide insights regarding business travel expenses. Their analysis of the data showed that New York was the most expensive city, with an average daily hotel room rate of $198 and an average amount spent on entertainment, including group meals and tickets for shows, sports, and other events, of $172. In comparison, the U.S. averages for these two categories were $89 for the room rate and $99 for entertainment. The table in the Excel Online file below shows the average daily hotel room rate and the amount spent on entertainment for a random sample of 9 of the 25 most visited U.S. cities (The…arrow_forwardWhich model—the one for parliaments or the one for ministries (or cabinets)—presented in the article has the greater explanatory power? How can you tell?arrow_forward
- The director of student services at San Bernardino Valley College is interested in whether women are just as likely to attend orientation as men before they begin their coursework. A random sample of freshmen at San Bernardino Valley College were asked to specify their gender and whether they attended the orientation. The results of the survey are shown below: Data for Gender vs. Orientation Attendance Women Men Yes 422 529 No 267 268 Let p1 be the proportion of women who attended the orientation and p2p2 be the proportion of men who attended the orientation. What can be concluded at the α = 0.10 level of significance? For this study, what sampling distribution should be used? Select an answer Chi-Square distribution uniform distribution standard normal distribution binomial distribution Student t distribution The null and alternative hypotheses would be: H0:H0: Select an answer μ μ1-μ2 p1-p2 μd p Select an answer ≠ < > = (please enter a decimal)…arrow_forwardIOG Technologies offers semiconductor and system solutions for automotive industrial and multimarket sectors for applications in communication. The following data relates to the production of three products manufactured by them: Product Price (RM) Quantity 2000 2016 2000 2016 BD-1005 3.00 3.20 60 80 LCM-2134 2.00 2.50 100 90 DDK-456 3.50 4.00 500 700 Determine the Laspeyres Price Index (LPI) and Paasche Price Index (PPI) for 2016 using 2000 as the base period.arrow_forwardIn general, ___________% of the values in a data set lie at or below the 28 th percentile. _______________ % of the values in a data set lie at or above the 90 th percentile.. If a sample consists of 700 test scores, _________of them would be at or below the 52 th percentile. If a sample consists of 700 test scores, ________ of them would be at or above the 64 th percentile.arrow_forward
- An auctioneer of antique Iranian rugs kept records of his weekly auctions in order to determine the relationships among price, age of carpet or rug, number of people attending the auction, and the number of times the winning bidder had previously attended his auctions. He felt that, with this information, he could plan his auctions better, serve his steady customers better, and make a higher overall profit for himself.arrow_forwardA student researcher was surprised to learn that the 2017 NCAA Student-Athlete Substance Use Survey supported that college athletes make healthier decisions in many areas than their peers in the general student body. He collected data of his own, focusing exclusively on male student-athletes to see if such habits vary based on one’s sport. He asked 93 male student-athletes whether they had engaged in binge-drinking in the last month (> 5 drinks in a single sitting). Data are provided in the table below. Lacrosse Hockey Swimming Row Totals Yes – Binge 20 17 15 52 No – did not binge 16 15 10 41 Column totals 36 32 25 93 1. Calculate the effect size. Show the formula and your calculations in the space provided below: 2. Using the degrees of freedom provided by your SPSS output and an alpha value of .05, find the critical value in the appropriate table in the Appendix of your Jackson e-book. Do not round – present all…arrow_forwardThe manager of an auto dealership would like to develop a model the fuel consumption of various car models based on engine size. The data is presented below. Manufacturer Engine Size (litre) Fuel Consumption (litres/100km,city driving) Hyundai Accent 1.5 8.9 Toyota Echo 1.5 7.1 Hyundai Accent 1.6 8.9 Kia rio 1.6 9.3 Mazda Protege 1.6 9.3 Honda Civic 1.7 8.1 Kia Spectra 1.8 10.9 Nissan Sentra 1.8 8.3 Pontiac Vibe 1.8 8.3 Toyota Corolla 1.8 8.1 Dodge SX 2.0 2 9.3 Ford Focus 2 8.9 Hyundai Elantra 2 9.6 Mazda Protege/proteges 2 9.9 Mitsubishi Lancer 2 9.7 Suzuki Aerio 2 9.1 Volkswagen Golf 2 10.1 Volkswagen Jetta 2 10.1 Chevrolet Cavalier 2.2 10 Oldsmobile Alero 2.2 10.1 Pontiac Grand AM 2.2 10 Saturn Ion 2.2 9.9 Saturn L200 2.2 10.1 Chrysler Sebring 2.4 10.6 Honda Accord 2.4 9.6 Hyundai Sonata 2.4 10.9 Kia Magentis 2.4 10.9 Mitsubishi Galant 2.4 11.3 Toyota Camry 2.4 10.2 Nissan Altima 2.5 10.4 Nissan Sentra 2.5 10.4…arrow_forward
 Glencoe Algebra 1, Student Edition, 9780079039897...AlgebraISBN:9780079039897Author:CarterPublisher:McGraw Hill