
Concept explainers
Videos
Volatility at the Pump The graph shows the average price per gallon of gasoline in the United States in January for the period from 2005 through 2011.
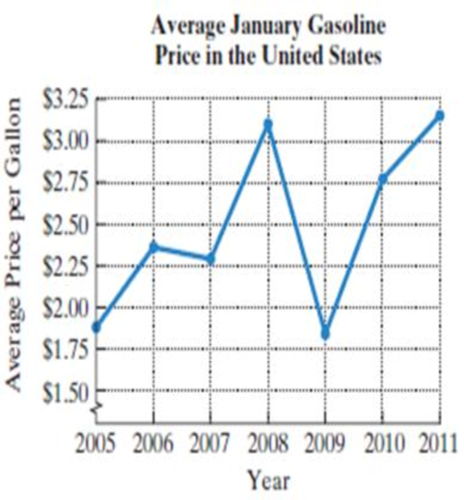
Source: U.S. Energy Information Administration
- a. For which years was the average price per gallon in January increasing?
- b. For which years was the average price per gallon in January decreasing?
- c. How many turning points (from increasing to decreasing or from decreasing to increasing) does the graph have for the period shown?
- d. Suppose that a polynomial function is used to model the data displayed by the graph using
(number of years after 2005, average January price per gallon).
Use the number of turning points to determine the degree of the polynomial function of best fit.
- e. For the model in part (d), should the leading coefficient of the polynomial function be positive or negative? Explain your answer.
- f. Use the graph to estimate the maximum average January price per gallon. In which year did this occur?
- g. Use the graph to estimate the minimum average January price per gallon. In which year did this occur?
Want to see the full answer?
Check out a sample textbook solution
Chapter 3 Solutions
MyLab Math with Pearson eText -- Standalone Access Card -- for College Algebra Essentials (5th Edition) (Cisco Top Score (NRP))
Additional Math Textbook Solutions
College Algebra with Modeling & Visualization (5th Edition)
Elementary Algebra
Elementary Algebra For College Students (10th Edition)
Algebra 1
Algebra: Structure And Method, Book 1
High School Math 2012 Common-core Algebra 1 Practice And Problem Solvingworkbook Grade 8/9


- Minimum Wage Use the graph below, which shows the minimum wages in the United States (in dollars) from 1950 through 2015. (a) Which decade shows the greatest increase in the minimum wage? (b) Approximate the percent increases in the minimum wage from 1985 to 2000 and from 2000 to 2015. (c) Use the percent increase from 2000 to 2015 to predict the minimum wage in 2030. (d) Do you believe that your prediction in part (c) is reasonable? Explain.arrow_forwardBuying a Car: If you buy a 25,000 car at an APR of 6, then your monthly payments depends on the term of the loan. If the term is t months, then your monthly payment is M=25,0000.0051.005t1.005t1dollars a. Make a graph of the monthly payments versus the length of the term, in months. Include terms from 12 to 60 months. b. Is the graph increasing or decreasing? What does that mean in practical terms? c. Do you lower your monthly payment more by changing the term of the loan from 12 to 24 months or from 48 to 60 months? Suggestion: you dont need a calculation here. The concavity of the graph can give you the answer.arrow_forwardFarms in the United States The graph gives the number of farms in the United States from 1850 to 2000. aEstimate the average rate of change in the number of farms between i 1860 and 1890 and ii 1950 and 1970. bIn which decade did the number of farms experience the greatest average rate of decline?arrow_forward
 Glencoe Algebra 1, Student Edition, 9780079039897...AlgebraISBN:9780079039897Author:CarterPublisher:McGraw Hill
 Functions and Change: A Modeling Approach to Coll...AlgebraISBN:9781337111348Author:Bruce Crauder, Benny Evans, Alan NoellPublisher:Cengage Learning
 Algebra and Trigonometry (MindTap Course List)AlgebraISBN:9781305071742Author:James Stewart, Lothar Redlin, Saleem WatsonPublisher:Cengage Learning
 Algebra & Trigonometry with Analytic GeometryAlgebraISBN:9781133382119Author:SwokowskiPublisher:Cengage
 Big Ideas Math A Bridge To Success Algebra 1: Stu...AlgebraISBN:9781680331141Author:HOUGHTON MIFFLIN HARCOURTPublisher:Houghton Mifflin Harcourt