Concept explainers
Videos
The graph shows stopping distances for tracks at various speeds on dry roads and on wet roads Use this information to solve Exercises 92-93.
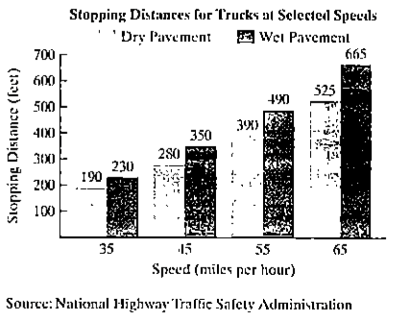
a. Use the statistical menu of your graphing utility and the quadratic regression program to obtain the quadratic function that models a truck's stopping distance. f(x), in feet, on dry pavement traveling at x miles per hour. Round the x-coefficient and the constant term to one decimal place.
b. Use the function from part (a) to determine speeds on dry pavement requiring slopping distances that exceed 455 feet. Round to the nearest mile per hour.
Want to see the full answer?
Check out a sample textbook solution
Chapter 3 Solutions
Algebra And Trigonometry With Integrated Review, Books A La Carte Edition, Plus Mylab Math With Pearson Etext -- Title-specific Access Card Package (6th Edition)


- Alligators The length in inches and weight in pounds of 25 alligators is shown in the table. Find the quadratic function that best fits the data. Round a,b, and c to six decimal places. Use the regression function to estimate the weight of an alligator that is 130 inches long. Round the weight to the nearest pound. Length Weight Length Weight Length Weight 94 130 72 38 90 106 74 51 128 366 89 84 147 640 85 84 68 39 58 28 82 80 76 42 86 80 86 83 114 197 94 110 88 70 90 102 63 33 72 61 78 57 86 90 74 54 69 36 61 44arrow_forwardAlligators Refer to Exercise 93. If an alligator weighs 125 pounds, what is its approximate length? Round to the nearest inch. 93. Alligators The length in inches and weight in pounds of 25 alligators is shown in the table. Find the quadratic function that best fits the data. Round a,b, and c to six decimal places. Use the regression function to estimate the weight of an alligator that is 130 inches long. Round the weight to the nearest pound. Length Weight Length Weight Length Weight 94 130 72 38 90 106 74 51 128 366 89 84 147 640 85 84 68 39 58 28 82 80 76 42 86 80 86 83 114 197 94 110 88 70 90 102 63 33 72 61 78 57 86 90 74 54 69 36 61 44arrow_forwardTEST FOR UNDERSTANDING FOR EXAMPLE 5.16 In the study Economics of Scale in High School Operation by J. Riew, the author studied data from the early 1960s on expenditures for high schools ranging from 150 to 2400 enrollment. The data he observed were similar to those in the table below. n=enrollment 200 600 1000 1400 1800 C=costperstudent,indollars 667.4 545.0 461.0 415.4 408.2 Model these data using a quadratic function. Round regression parameters to four decimal places. According to this model, what enrollment produces the minimum cost per student?arrow_forward
 College Algebra (MindTap Course List)AlgebraISBN:9781305652231Author:R. David Gustafson, Jeff HughesPublisher:Cengage Learning
 Functions and Change: A Modeling Approach to Coll...AlgebraISBN:9781337111348Author:Bruce Crauder, Benny Evans, Alan NoellPublisher:Cengage Learning
 Algebra & Trigonometry with Analytic GeometryAlgebraISBN:9781133382119Author:SwokowskiPublisher:Cengage