Concept explainers
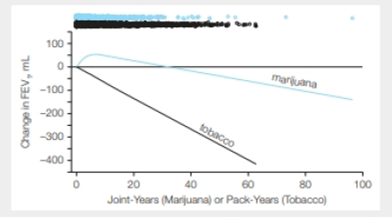
Smoking and Lung Function Data from the Coronary Artery Risk Development in Young Adults (CARDIA) study was used to assess the effects of smoking on lung function. In 1985--86, the study enrolled about 5,000 people aged 18 to 30 years old in a long term study. Over the next 20 years, study subjects were periodically asked about their habits and their health, including their lung function, was assessed. FIGURE 38.19 is a model based on data from this study, of how lifetime tobacco and marijuana use affects forced expiration.

FIGURE 38.19 Associations between marijuana or tobacco smoking and the change in forced expiration volume (FEV). One joint-year means an average of one joint smoked daily for one year. One pack-year is an average of one pack smoked per day for one year. Dots at the top of the graph show the distribution of observations. Lines below show the modeled association. Blue is marijuana and black is tobacco. The change in FEV1 is given as milliliters of air.
Relatively few people had the highest level of lifetime marijuana exposure. How might additional data from such users alter the model?
Want to see the full answer?
Check out a sample textbook solution
Chapter 38 Solutions
Biology: The Unity and Diversity of Life (MindTap Course List)
- Smoking and Lung Function Data from the Coronary Artery Risk Development in Young Adults (CARDIA) study was used to assess the effects of smoking on lung function. In 1985--86, the study enrolled about 5,000 people aged 18 to 30 years old in a long term study. Over the next 20 years, study subjects were periodically asked about their habits and their health, including their lung function, was assessed. FIGURE 38.19 is a model based on data from this study, of how lifetime tobacco and marijuana use affects forced expiration. FIGURE 38.19 Associations between marijuana or tobacco smoking and the change in forced expiration volume (FEV). One joint-year means an average of one joint smoked daily for one year. One pack-year is an average of one pack smoked per day for one year. Dots at the top of the graph show the distribution of observations. Lines below show the modeled association. Blue is marijuana and black is tobacco. The change in FEV1 is given as milliliters of air. Based on this model, how would smoking two packs of cigarettes a day for 20 years (40 pack-years or exposure) affect FEV1? What level of marijuana smoking would produce an equivalent effect?arrow_forwardLycopene, which is abundant in tomatoes, is thought to have a potential benefit in protecting against many types of cancers. In the study, the results of which are shown in the Figure, mice were exposed to tobacco smoke or normal air. The amount of lung tissue damage caused by each exposure was measured in mice that were given tomato juice (1) or water (2). To estimate the destruction of the alveolar wall, a destructive index (DI) was calculated from histological slides of the lung. All lungs will show some level of damage, but a DI above 10% is considered significant destruction. What is the effect of tobacco smoke on the lung tissue in these mice? Source: Based on S. Kasagi et al. 2006. Tomato juice prevents senescence-accelerated mouse P1 strain from developing emphysema induced by chronic exposure to tobacco smoke. American Journal of PhysiologyLung Cellular and Molecular Physiology 290:L396L404.arrow_forwardAt various points throughout Earth’s geological history, atmospheric and oceanic oxygen levels have been different than they are today. If future oxygen levels in the ocean become higher than they are today, what effect do you think this will have on the relative frequencies with which ram ventilation or buccopharyngeal pumping are used by aquatic vertebrates? Please explain your answer.arrow_forward
- True or False: By comparing the evaginated respiratory structures of aquatic organisms (e.g. gills, skin folds) with the invaginated respiratory structures of terrestrial organisms (below), we can conclude that invaginated lungs and tracheal systems are an adaptation to terrestrial life.arrow_forwardWhich of the following can increase oxygen delivery to an actively metabolizing tissue? A. local reduction in pH in the active tissue B. relaxation of precapillary sphincters within the active tissue C. increased blood pressure as a consequence of tachycardia (that is, increased heart rate) D. increase in the number of open, perfused capillaries in the active tissue E. All of the above answer choices correctly answer the question.arrow_forwardWhich of the following provides the best evidence that the circulatory system and the respiratory system work together to carry out their functions?arrow_forward
- In carbon monoxide (CO) poisoning, CO binds to the heme of hemoglobin much tighter than oxygen (O2). What effect will this have on the ability of the tissues to get oxygen? Group of answer choices There will be no effect. CO will deliver oxygen to the tissues. Hemoglobin will bind more O2 and deliver more oxygen to the tissues. More hemoglobin will be produced to deliver oxygen to the tissues. Hemoglobin will bind less O2 and deliver less oxygen to the tissues.arrow_forwardA student undertakes a project to determine the effect of carbon dioxide on respiration rate using the following methodology. A volunteer inhaled air from a bag containing a predetermined amount of carbon dioxide (with partial pressure in torr) and the number of breaths per minute was recorded. Her data are given below: Partial pressure CO2 (torr) Respiration rate (breaths/minute) 30 8.1 32 8.0 34 9.9 36 11.2 38 11.0 40 13.2 42 14.6 44 16.6 46 16.7 48 18.3 50 18.2 Choose the best statistical test for this study. a. Correlation b. Simple Linear Regression c. Non-Linear Regression d. General Linear Model Regressionarrow_forwardWhen researchers first discovered that airflow through a bird’s paleopulmonal parabronchi is unidirectional, the question arose as to whether gas exchange is countercurrent, cocurrent, or cross- current. Some ingenious investigators carried out experiments in which they measured the efficiency of gas exchange between air and blood in duck lungs when parabronchial airflow was in its normal direction and when the direction of parabronchial airflow was artificially reversed. The efficiency did not change. How is this evidence against countercurrent and cocurrent gas exchange? How is this evidence for cross-current exchange?arrow_forward
- Can you explain how scaling laws apply to the lungs/respiratory system? What are the implications of scaling laws to humans becoming really small or big?arrow_forwardWhich of the following statements about the oxygen-binding curves is FALSE? Select one: a. During normal activity (not exercising) the blood PO2 rarely falls below 40 mmHg. b. The PO2 and hemoglobin dissociation curve for myoglobin is to the left of fetal hemoglobin. c. The blood returning to the lungs is still 75% saturated with oxygen. d. A larger decrease in PO2 is needed for hemoglobin to drop from 100% to 75% O2 capacity than from 75% to 50% O2 capacity. e. During high metabolic activity the PO2 and hemoglobin dissociation curve would be expected to shift to the left of normal.arrow_forwardWhich of the following factors would increase the oxygen carrying capacity of the blood? Question 6 options: A 50% increase in hematocrit in combination with blood cells that have half the concentration of hemoglobin? A 20% increase in myoglobin levels. An increase in temperature. An increase in pH none of the above would increase the total amount of oxygen carried by the bloodarrow_forward
 Biology: The Unity and Diversity of Life (MindTap...BiologyISBN:9781337408332Author:Cecie Starr, Ralph Taggart, Christine Evers, Lisa StarrPublisher:Cengage Learning
 Biology: The Dynamic Science (MindTap Course List)BiologyISBN:9781305389892Author:Peter J. Russell, Paul E. Hertz, Beverly McMillanPublisher:Cengage Learning
 Comprehensive Medical Assisting: Administrative a...NursingISBN:9781305964792Author:Wilburta Q. Lindh, Carol D. Tamparo, Barbara M. Dahl, Julie Morris, Cindy CorreaPublisher:Cengage Learning
 Concepts of BiologyBiologyISBN:9781938168116Author:Samantha Fowler, Rebecca Roush, James WisePublisher:OpenStax College


