
Financial Reporting, Financial Statement Analysis and Valuation
8th Edition
ISBN: 9781285190907
Author: James M. Wahlen, Stephen P. Baginski, Mark Bradshaw
Publisher: Cengage Learning
expand_more
expand_more
format_list_bulleted
Videos
Textbook Question
Chapter 4, Problem 1AAIC
Integrative Case 1.1 introduced the industry economics of coffee shops and the business strategy of Starbucks to compete in this industry. Exhibit 1.26 presents balance sheets for Starbucks for the years ending 2009–2012. Exhibit 1.27 presents its income statements and Exhibit 1.28 presents the statement of cash flows for the same years. Exhibit 1.29 presents common-size balance sheets and Exhibit 1.30 presents common-size income statements for Starbucks. Before beginning preparation of Integrative Case 4.1, we recommend that you review Integrative Case 1.1 in Chapter 1.
Part A of Integrative Case 4.1 analyzes changes in the profitability of Starbucks.
REQUIRED
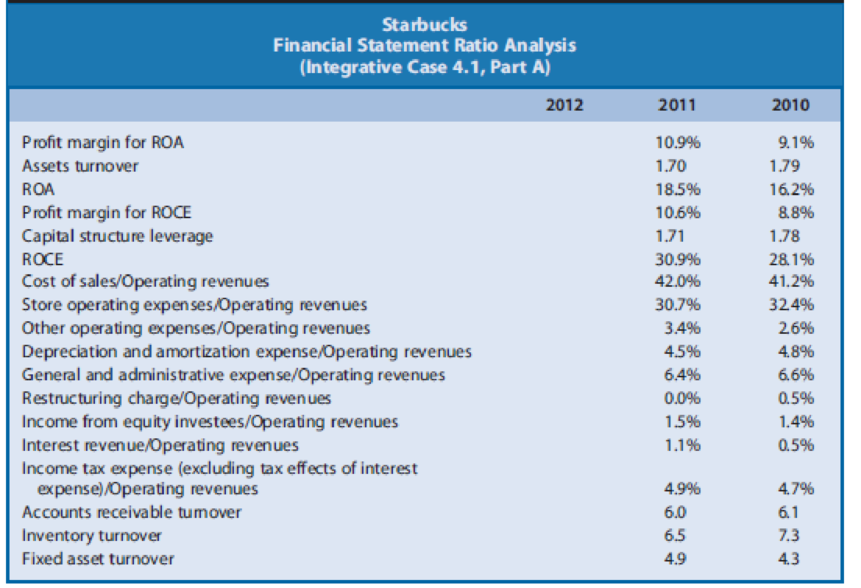
- a. Exhibit 4.43 presents profitability ratios for Starbucks for fiscals 2010 and 2011. Using the financial statement data in Exhibits 1.26 and 1.27, compute the values of these ratios for fiscal 2012. The income tax rate is 35%. For accounts receivable turnover, use only specialty revenues for the numerator, because the accounts receivable are primarily related to licensing and food service operations, not the retail operations. Use cost of sales, including occupancy costs, for the numerator of the inventory turnover, because Starbucks does not disclose separately the cost of products sold (the appropriate numerator) and occupancy costs.
- b. What are the most important reasons for Starbucks’
ROA fluctuation during the three-year period? Analyze the financial ratios to the maximum depth possible with the information given. Using the nomenclature from the schematic in Exhibit 4.21 (page 298), Exhibit 4.44 (page 320) provides information for analyzing profitability at Level 1, Level 2, and Level 3. Exhibit 4.44 presents additional information for Starbucks at a business segment level to permit analysis at Level 4. Differences between the sum of segment expenses and total expenses reflect corporate-level expenses not allocated to the individual segments. Additionally, if necessary, access Starbuck’s annual report or form 10-K, which you should be able to access at the company’s investor relations website. - c. What are the most important reasons for Starbucks’ ROCE fluctuation during the three-year period?
Exhibit 4.43
Expert Solution & Answer
Want to see the full answer?
Check out a sample textbook solution
Students have asked these similar questions
Working with the Takeaways throughout this chapter we have considered the financial statements of Apple Inc. and have undertaken select financial analysis using the Takeaways. Utilize
these same tools to analyze the financial data of
Logitech International, a manufacturer of computer peripherals. The following information was reported by Logitech in the company’s financial statements as of year-end March 31, 2017 and 2016.1. Calculate the return on sales ratio for each year and comment on Logitech’s profitability.2. Calculate the current ratio for each year and comment on Logitech’s liquidity.3. Calculate the debt-to-total-assets ratio for each year and comment on Logitech’s solvency. 4. Calculate the free cash flow for each year and comment on what this means for Logitech. 5. Apple’s fiscal year-end occurs near the end of September, whereas Logitech uses a March year-end. How might this affect a comparison of the financial results of the two companies?
Coca-Cola and PepsiCo both produce and market beverages that are direct competitors. Key financialfigures for these businesses for a recent year follow.Key Figures ($ millions) Coca-Cola PepsiCoSales . $46,542 $66,504Net income . 8,634 6,462Average assets . . . . . . . . . . . . . . . . . . . . 76,448 70,518Required Write a one-paragraph memorandum explaining which company you would invest your money in and why. (Limit your explanation to the information provided.)
Chapter 4 Solutions
Financial Reporting, Financial Statement Analysis and Valuation
Ch. 4 - Common-Size Analysis. Common-size analysis is a...Ch. 4 - Earnings per Share. Firm A reports an increase in...Ch. 4 - Prob. 3QECh. 4 - Profit Margin for ROA versus ROCE. Describe the...Ch. 4 - Concept and Measurement of Financial Leverage....Ch. 4 - Advantages of Financial Leverage. A company...Ch. 4 - Prob. 7QECh. 4 - Nucor, a steel manufacturer, reported net income...Ch. 4 - Phillips-Van Heusen, an apparel manufacturer,...Ch. 4 - TJX, Inc., an apparel retailer, reported net...
Ch. 4 - Boston Scientific, a medical device manufacturer,...Ch. 4 - Valero Energy, a petroleum company, reported net...Ch. 4 - Exhibit 4.22 presents selected operating data for...Ch. 4 - Microsoft Corporation (Microsoft) and Oracle...Ch. 4 - Prob. 17PCCh. 4 - Prob. 18PCCh. 4 - Texas Instruments (TI) designs and manufactures...Ch. 4 - JCPenney operates a chain of retail department...Ch. 4 - Prob. 21PCCh. 4 - Selected data for General Mills for 2007, 2008,...Ch. 4 - Prob. 23PCCh. 4 - Hasbro is a leading firm in the toy, game, and...Ch. 4 - Fitch sells casual apparel and personal care...Ch. 4 - Prob. 26PCCh. 4 - Starwood Hotels (Starwood) owns and operates many...Ch. 4 - Select data for Avis and Hertz for 2012 follow....Ch. 4 - Integrative Case 1.1 introduced the industry...Ch. 4 - Prob. 1ABICCh. 4 - Prob. 1ACICCh. 4 - Prob. 1BAICCh. 4 - Prob. 1BBICCh. 4 - Walmart and Carrefour follow similar strategies....Ch. 4 - Walmart and Carrefour follow similar strategies....
Knowledge Booster


Learn more about
Need a deep-dive on the concept behind this application? Look no further. Learn more about this topic, finance and related others by exploring similar questions and additional content below.Similar questions
- Starbucks The first case at the end of this chapter and numerous subsequent chapters is a series of integrative cases involving Starbucks. The series of cases applies the concepts and analytical tools discussed in each chapter to Starbucks financial statements and notes. The preparation of responses to the questions in these cases results in an integrated illustration of the six sequential steps in financial statement analysis discussed in this chapter and throughout the book. Introduction They dont just sell coffee; they sell the Starbucks Experience, remarked Deb Mills while sitting down to enjoy a cup of Starbucks cappuccino with her friend Kim Shannon. Kim, an investment fund manager for a large insurance firm, reflected on that observation and what it might mean for Starbucks as a potential investment opportunity. Glancing around the store, Kim saw a number of people sitting alone or in groups, lingering over their drinks while chatting, reading, or checking e-mail and surfing the Internet through the stores wi-fi network. Kim noted that in addition to the wide selection of hot coffees, French and Italian style espressos, teas, and cold coffee-blended drinks, Starbucks also offered food items and baked goods, packages of roasted coffee beans, coffee-related accessories and equipment, and even its own line of CDs. Intrigued, Kim made a mental note to do a full financial statement and valuation analysis of Starbucks to evaluate whether its business model and common equity shares were as good as their coffee. Growth Strategy Kims research quickly confirmed her friends observation that Starbucks is about the experience of enjoying a good cup of coffee. The Starbucks 2012 Form 10-K (page 3) asserts the following: Our retail objective is to be the leading retailer and brand of coffee in each of our target markets by selling the finest quality coffee and related products, and by providing each customer a unique Starbucks Experience. The Starbucks Experience is built upon superior customer service as well as clean and well-maintained company operated stores that reflect the personalities of the communities in which they operate, thereby building a high degree of customer loyalty. The Starbucks experience strives to create a third placesomewhere besides home and work where a customer can feel comfortable and welcomethrough friendly and skilled customer service in clean and personable retail store environments. This approach enabled Starbucks to grow rapidly from just a single store near Pikes Place Market in Seattle to a global company with 18,066 locations worldwide at the end of fiscal 2012. Of that total, Starbucks owned and operated 9,405 stores (7,857 stores in the Americas; 882 stores in the Europe, Middle East Africa (EMEA) region; and 666 stores in the China and Asia Pacific (CAP) region). In addition, licensees owned and operated a total of 8,661 stores (5,046 stores in the Americas; 987 stores in the EMEA region; and 2,628 stores in the CAP region). Most of Starbucks stores at the end of fiscal 2012 were located in the United States, amounting to one Starbucks retail location for every 28,000 U.S. residents. However, Starbucks was clearly not a company content to focus simply on the U.S. market, as it was extending the reach of its stores globally, with thousands of stores outside the United States. At the end of fiscal 2012, Starbucks owned and operated stores in a number of countries around the world, including 878 stores in Canada, 593 stores in the United Kingdom, and 408 stores in China. Starbucks success can be attributed in part to its successful development and expansion of a European ideaenjoying a fine coffee-based beverage and sharing that experience with others in a comfortable, friendly environment with pleasant, competent service. Starbucks imported the idea of the French and Italian caf into the busy North American lifestyle. Ironically, Starbucks successfully extended its brand and style of a caf into the European continent. On January 16, 2004, Starbucks opened its first coffeehouse in Francein the heart of Paris at 26 Avenue de IOperaand had a total of 67 stores in France by the end of 2012. The success of Starbucks retail coffeehouse concept is illustrated by the fact that by the end of 2012, Star-bucks had opened over 1,100 company-operated and licensed locations in Europe, with the majority of them in the United Kingdom. Not long ago, Starbucks CEO Howard Schultz stated that his vision and ultimate goal for Starbucks was to have 20,000 Starbucks retail locations in the United States, to have another 20,000 retail locations in international markets worldwide, and to have Starbucks recognized among the worlds leading brands. Kim Shannon wondered whether Starbucks could ultimately achieve that level of global penetration because she could name only a few such worldwide companies. Among those that came to mind were McDonalds, with more than 34,000 retail locations in 118 countries; Subway, with more than 34,000 locations in 90 countries; and Yum! Brands, with more than 40,000 restaurants in 130 countries under brand names such as KFC, Pizza Hut, and Taco Bell. Growth in the number of retail stores had been one of the primary drivers of Starbucks growth in revenues. The most significant area of expansion of the Starbucks model in recent years has been the rapid growth in the number of licensed retail stores. At the end of fiscal 1999, Starbucks had only 363 licensed stores, but by the end of fiscal 2012, the number of licensed stores had mushroomed to 8,661. Recent Performance Performance in recent years caused Kim to question whether Starbucks had already reached (or perhaps exceeded) its full potential. She wondered whether it could generate the impressive growth in new stores and revenues that it had created in the past. In fiscal year 2008, Starbucks opened 1,669 net new retail locations (698 net new company-owned stores and 971 new licensed stores), but this number was well below the initial target of 2,500 new stores and well below the 2,571 new stores opened in 2007. Late in 2008, Starbucks announced a plan to close approximately 600 underperforming stores in the United States as well as 64 underperforming stores in Australia. The store closings triggered restructuring charges that reduced Starbucks operating income by 266.9 million in 2008. During fiscal 2009, they increased the restructuring plan to close a total of approximately 800 U.S. stores (an increase of 200), and managed to close 566 U.S. stores during the year. They also announced a plan to close 100 stores in various international markets. The 2009 store closings triggered additional restructuring charges that reduced Starbucks operating income by 332.4 million in 2009. In 2009, for the first time in company history, Starbucks net store growth was negative, with a net of 474 stores closed in the United States (92 stores opened net of 566 closed) and only 89 net new international stores opened (130 stores opened net of 41 closed), for a net total closure of 385 company operated stores. In fiscal 2009, total revenues fell to 9,775 billion from 10,383 billion in fiscal 2008. Fiscal 2009 marked the first year of revenue decline (5.9%) in company history. Prior to 2009, Star-bucks had generated impressive revenue growth rates of 10.3% in fiscal 2008; 20.9% growth in fiscal 2007; and 22.2% in fiscal 2006. Starbucks revenue growth is not just driven by opening new stores; it is also driven by sales growth among existing stores. Through 2007, Starbucks could boast of a streak of 16 consecutive years in which it achieved comparable store sales growth rates equal to or greater than 5%, but that string was broken with negative 3% comparable store sales growth in 2008. Unfortunately, things got worse in 2009, because Starbucks company-operated stores generated a negative 6% growth in comparable U.S. store sales, a negative 2% growth in comparable international store sales, and a negative 6% growth in comparable store sales overall. In response to the downturn in Starbucks business, in January, 2009, Howard Schultz returned from retirement and reassumed his role as president and CEO of Starbucks in order to restructure the business and its potential for growth. Focal points of his transformation plan included taking a more disciplined approach to new store openings, reinvigorating the Star-bucks Experience, developing and implementing even better service and quality, while cutting operating and overhead costs. In addition, the transformation plans included introducing more new beverage and food offerings, such as baked goods, breakfast items and chilled and other foods. A key to Starbucks profit growth lies in increasing same store sales growth via new products. Starbucks regularly introduces new specialty coffee-based drinks and coffee flavors, as well as iced coffee-based drinks, such as the very successful line of Frappuccino drinks and Shaken Iced Refreshment drinks. Under Schultzs renewed leadership, comparable store sales growth rebounded impressively, to 7% growth among U.S. stores and 6% among international stores. Starbucks store openings were very conservative in 2010, owing in part to the difficult economic conditions in the primary markets. In the United States, Starbucks only opened a net 3 new stores in 2010opening 60 licensed stores while closing 57 company-owned stores. Internationally, Star-bucks opened 220 new stores in 2010opening 235 licensed stores while closing 15 company-owned stores. Overall revenue growth also rebounded, reaching 10.7 billion (up 9.5% from 2009). Starbucks continued this modest new store growth trajectory into 2011. Among company-owned stores, Starbucks opened 49 but closed 51 in the United States and opened 180 but closed 36 international stores. Starbucks licensees opened 345 new stores internationally and 133 new stores in the United States. Unfortunately, because Borders Bookstores went bankrupt in 2011, it closed the 475 Starbucks stores that it had licensed. This caused a net negative growth of 342 licensee closings in 2011 in the United States. Overall revenue again sustained healthy growth, with total revenues reaching 11.7 billion (up 9.3% from 2010). Kim was even more encouraged with Starbucks growth in fiscal 2012. During that period, Starbucks opened a total of 1,063 new stores. Of those, Starbucks opened 234 company-owned and 270 licensed stores in the Americas. In the EMEA region, Starbucks opened 10 company-owned and 101 licensed stores, as well as 154 company-owned and 294 licensed stores in the CAP region. Overall revenue reached 13.3 billion (up 14% from 2011). Starbucks also continues to expand the scope of its business model through new channel development in order to reach customers where they work, travel, shop, and dine. To further expand the business model, Starbucks terminated its licensing and distribution agreement with Kraft Foods and now manages its own marketing and distribution of Starbucks whole bean and ground coffee to grocery stores and warehouse club stores. By the end of fiscal 2012, Star-bucks whole bean and ground coffees were available throughout the United States in approximately 39,000 grocery and warehouse club stores. Further, Starbucks sells whole bean and ground coffee through institutional foodservice companies that service business, education, office, hotel, restaurant, airline, and other foodservice accounts. For example, in 2012 Starbucks (and their subsidiary, Seattles Best Coffee) were the only superpremium national brand coffees promoted by Sysco Corporation to such foodservice accounts. Finally, Starbucks had formed partnerships to produce and distribute bottled Frappuccino and DoubleShot drinks with PepsiCo and premium ice creams with Unilever. Despite Starbucks past difficulties with store closings, restructuring charges, and negative comparable store sales growth rates, Kim could see some very positive aspects of Starbucks financial performance and condition. She noted that Starbucks had been profitable in 2008 and 2009, despite the difficulties. She also noted that Starbucks generated record high profits in 2010, 2011, and 2012, suggesting the restructuring and turnaround efforts were proving successful. The restructuring plan was seemingly complete and had helped Starbucks to reduce costs. Further, she noted that Starbucks operating cash flows had remained fairly strong throughout this period. With its positive operating cash flows, Starbucks had retired all of the 713 million in commercial paper and short-term borrowings during 2009, initiated the first dividend in company history in 2010, resumed repurchasing common shares in 2010, and had grown the combined balances in cash and short-term investments over 2.0 billion by fiscal year-end 2012. Product Supply Starbucks purchases green coffee beans from coffee-producing regions around the world and custom roasts and blends them to its exacting standards. Although coffee beans trade in commodity markets and experience volatile prices, Starbucks purchases higher-quality coffee beans that sell at a premium to commodity coffees. Starbucks purchases its coffee beans under fixed-price purchase contracts with various suppliers, with purchase prices reset annually. Starbucks also purchases significant amounts of dairy products from suppliers located near its retail stores. Starbucks purchases paper and plastic products from several suppliers, the prices of which vary with changes in the prices of commodity paper and plastic resin. Competition in the Specialty Coffee Industry After some reflection, Kim realized that Starbucks faced intense direct competition. Kim could think of a wide array of convenient retail locations where a person can purchase a cup of coffee. Kim reasoned that Starbucks competes with a broad scope of coffee beverage retailers, including fast-food chains (for example, McDonalds), doughnut chains (for example, Krispy Kreme, Dunkin Donuts, and Tim Hortons), and convenience stores associated with many gas stations, but that these types of outlets offer an experience that is very different from what Starbucks offers. In particular, Kim was aware that McDonald's had started to expand development of its McCaf shops, which sold premium coffee drinks (lattes, cappuccinos, and mochas) in McDonalds restaurants. It appeared to Kim that the McCaf initiative was intended to be a direct competitive challenge to Starbucks business. Kim also identified a number of companies that were growing chains of retail coffee shops that could be compared to Starbucks, including firms such as Panera Bread Company; Diedrich Coffee; New World Restaurant Group, Inc.; and Caribou Coffee Company, Inc. (a privately held firm). However, these firms were much smaller than Starbucks, with the largest among them being the Panera Bread Company, with approximately 1,700 bakery-cafs system-wide at the end of 2012. On the other end of the spectrum, Kim was aware that Starbucks faced competition from local independent coffee shops and cafs. Kim recognized that despite facing extensive competition, Starbucks had some distinct competitive advantages. Very few companies were implementing a business strategy comparable to that of Starbucks, with emphasis on the quality of the experience, the products, and the service. In addition, only the fast-food chains and the doughnut chains operated on the same scale as Starbucks. Finally, Starbucks had developed a global brand that was synonymous with the quality of the Starbucks experience. Recently, Interbrand ranked the Starbucks brand as one of the worlds top 100 most valuable brand names, estimating it to be worth in excess of 4 billion. The Valuation Controversy In beginning to research Starbucks share price (ticker: SBUX), Kim realized that it had experienced a wild ride over the past five years, following a very similar pattern to Starbucks earnings performance during that time. Starbucks had been one of the hottest companies in the capital market, in large part due to its impressive growth in sales and earnings, up until December of 2006. SBUXs share price had appreciated dramatically, generating cumulative returns that far exceeded those of the SP 500 over that period. The market for Starbucks shares cooled beginning in early 2007, with share prices falling from a high of nearly 40 to a low of under 8 in November of 2008. Since that low point, Starbucks share price began a dramatic recovery. Over the calendar year 2012, SBUX stock price ranged between 42 and 62 per share, and was currently trading at 50 per share, implying a PE ratio of over 28 (based on trailing 12 months earnings per share of 1.79), an earnings multiple that is well above the industry average. Kim further discovered that the capital markets and analysts have mixed opinions on the SBUX stock value. Kim found one-year-ahead price targets from 24 analysts, ranging from a low of 49 to a high of 65, with a mean (median) price target of 59 (60). She found that 30 analysts issued investment recommendations for SBUX: eleven recommend strong buy, ten recommend buy, nine recommend hold, and no analysts recommend sell. The consensus analysts earnings per share forecasts are 2.15 for fiscal 2013 and 2.62 for fiscal 2014. Financial Statements Exhibit 126 presents comparative balance sheets. Exhibit 1.27 presents comparative income statements, and Exhibit 1.28 (pages 7677) presents comparative statements of cash flows for Starbucks for the four fiscal years ending September 30, 2012. Starbucks includes short-term investments in current assets on the balance sheet, yet it reports purchases and sales of investment securities as investing activities on the statement of cash flows. Explain why changes in investment securities are investing activities while changes in most other current assets (such as accounts receivable and inventories) are operating activities.arrow_forwardStarbucks The first case at the end of this chapter and numerous subsequent chapters is a series of integrative cases involving Starbucks. The series of cases applies the concepts and analytical tools discussed in each chapter to Starbucks financial statements and notes. The preparation of responses to the questions in these cases results in an integrated illustration of the six sequential steps in financial statement analysis discussed in this chapter and throughout the book. Introduction They dont just sell coffee; they sell the Starbucks Experience, remarked Deb Mills while sitting down to enjoy a cup of Starbucks cappuccino with her friend Kim Shannon. Kim, an investment fund manager for a large insurance firm, reflected on that observation and what it might mean for Starbucks as a potential investment opportunity. Glancing around the store, Kim saw a number of people sitting alone or in groups, lingering over their drinks while chatting, reading, or checking e-mail and surfing the Internet through the stores wi-fi network. Kim noted that in addition to the wide selection of hot coffees, French and Italian style espressos, teas, and cold coffee-blended drinks, Starbucks also offered food items and baked goods, packages of roasted coffee beans, coffee-related accessories and equipment, and even its own line of CDs. Intrigued, Kim made a mental note to do a full financial statement and valuation analysis of Starbucks to evaluate whether its business model and common equity shares were as good as their coffee. Growth Strategy Kims research quickly confirmed her friends observation that Starbucks is about the experience of enjoying a good cup of coffee. The Starbucks 2012 Form 10-K (page 3) asserts the following: Our retail objective is to be the leading retailer and brand of coffee in each of our target markets by selling the finest quality coffee and related products, and by providing each customer a unique Starbucks Experience. The Starbucks Experience is built upon superior customer service as well as clean and well-maintained company operated stores that reflect the personalities of the communities in which they operate, thereby building a high degree of customer loyalty. The Starbucks experience strives to create a third placesomewhere besides home and work where a customer can feel comfortable and welcomethrough friendly and skilled customer service in clean and personable retail store environments. This approach enabled Starbucks to grow rapidly from just a single store near Pikes Place Market in Seattle to a global company with 18,066 locations worldwide at the end of fiscal 2012. Of that total, Starbucks owned and operated 9,405 stores (7,857 stores in the Americas; 882 stores in the Europe, Middle East Africa (EMEA) region; and 666 stores in the China and Asia Pacific (CAP) region). In addition, licensees owned and operated a total of 8,661 stores (5,046 stores in the Americas; 987 stores in the EMEA region; and 2,628 stores in the CAP region). Most of Starbucks stores at the end of fiscal 2012 were located in the United States, amounting to one Starbucks retail location for every 28,000 U.S. residents. However, Starbucks was clearly not a company content to focus simply on the U.S. market, as it was extending the reach of its stores globally, with thousands of stores outside the United States. At the end of fiscal 2012, Starbucks owned and operated stores in a number of countries around the world, including 878 stores in Canada, 593 stores in the United Kingdom, and 408 stores in China. Starbucks success can be attributed in part to its successful development and expansion of a European ideaenjoying a fine coffee-based beverage and sharing that experience with others in a comfortable, friendly environment with pleasant, competent service. Starbucks imported the idea of the French and Italian caf into the busy North American lifestyle. Ironically, Starbucks successfully extended its brand and style of a caf into the European continent. On January 16, 2004, Starbucks opened its first coffeehouse in Francein the heart of Paris at 26 Avenue de IOperaand had a total of 67 stores in France by the end of 2012. The success of Starbucks retail coffeehouse concept is illustrated by the fact that by the end of 2012, Star-bucks had opened over 1,100 company-operated and licensed locations in Europe, with the majority of them in the United Kingdom. Not long ago, Starbucks CEO Howard Schultz stated that his vision and ultimate goal for Starbucks was to have 20,000 Starbucks retail locations in the United States, to have another 20,000 retail locations in international markets worldwide, and to have Starbucks recognized among the worlds leading brands. Kim Shannon wondered whether Starbucks could ultimately achieve that level of global penetration because she could name only a few such worldwide companies. Among those that came to mind were McDonalds, with more than 34,000 retail locations in 118 countries; Subway, with more than 34,000 locations in 90 countries; and Yum! Brands, with more than 40,000 restaurants in 130 countries under brand names such as KFC, Pizza Hut, and Taco Bell. Growth in the number of retail stores had been one of the primary drivers of Starbucks growth in revenues. The most significant area of expansion of the Starbucks model in recent years has been the rapid growth in the number of licensed retail stores. At the end of fiscal 1999, Starbucks had only 363 licensed stores, but by the end of fiscal 2012, the number of licensed stores had mushroomed to 8,661. Recent Performance Performance in recent years caused Kim to question whether Starbucks had already reached (or perhaps exceeded) its full potential. She wondered whether it could generate the impressive growth in new stores and revenues that it had created in the past. In fiscal year 2008, Starbucks opened 1,669 net new retail locations (698 net new company-owned stores and 971 new licensed stores), but this number was well below the initial target of 2,500 new stores and well below the 2,571 new stores opened in 2007. Late in 2008, Starbucks announced a plan to close approximately 600 underperforming stores in the United States as well as 64 underperforming stores in Australia. The store closings triggered restructuring charges that reduced Starbucks operating income by 266.9 million in 2008. During fiscal 2009, they increased the restructuring plan to close a total of approximately 800 U.S. stores (an increase of 200), and managed to close 566 U.S. stores during the year. They also announced a plan to close 100 stores in various international markets. The 2009 store closings triggered additional restructuring charges that reduced Starbucks operating income by 332.4 million in 2009. In 2009, for the first time in company history, Starbucks net store growth was negative, with a net of 474 stores closed in the United States (92 stores opened net of 566 closed) and only 89 net new international stores opened (130 stores opened net of 41 closed), for a net total closure of 385 company operated stores. In fiscal 2009, total revenues fell to 9,775 billion from 10,383 billion in fiscal 2008. Fiscal 2009 marked the first year of revenue decline (5.9%) in company history. Prior to 2009, Star-bucks had generated impressive revenue growth rates of 10.3% in fiscal 2008; 20.9% growth in fiscal 2007; and 22.2% in fiscal 2006. Starbucks revenue growth is not just driven by opening new stores; it is also driven by sales growth among existing stores. Through 2007, Starbucks could boast of a streak of 16 consecutive years in which it achieved comparable store sales growth rates equal to or greater than 5%, but that string was broken with negative 3% comparable store sales growth in 2008. Unfortunately, things got worse in 2009, because Starbucks company-operated stores generated a negative 6% growth in comparable U.S. store sales, a negative 2% growth in comparable international store sales, and a negative 6% growth in comparable store sales overall. In response to the downturn in Starbucks business, in January, 2009, Howard Schultz returned from retirement and reassumed his role as president and CEO of Starbucks in order to restructure the business and its potential for growth. Focal points of his transformation plan included taking a more disciplined approach to new store openings, reinvigorating the Star-bucks Experience, developing and implementing even better service and quality, while cutting operating and overhead costs. In addition, the transformation plans included introducing more new beverage and food offerings, such as baked goods, breakfast items and chilled and other foods. A key to Starbucks profit growth lies in increasing same store sales growth via new products. Starbucks regularly introduces new specialty coffee-based drinks and coffee flavors, as well as iced coffee-based drinks, such as the very successful line of Frappuccino drinks and Shaken Iced Refreshment drinks. Under Schultzs renewed leadership, comparable store sales growth rebounded impressively, to 7% growth among U.S. stores and 6% among international stores. Starbucks store openings were very conservative in 2010, owing in part to the difficult economic conditions in the primary markets. In the United States, Starbucks only opened a net 3 new stores in 2010opening 60 licensed stores while closing 57 company-owned stores. Internationally, Star-bucks opened 220 new stores in 2010opening 235 licensed stores while closing 15 company-owned stores. Overall revenue growth also rebounded, reaching 10.7 billion (up 9.5% from 2009). Starbucks continued this modest new store growth trajectory into 2011. Among company-owned stores, Starbucks opened 49 but closed 51 in the United States and opened 180 but closed 36 international stores. Starbucks licensees opened 345 new stores internationally and 133 new stores in the United States. Unfortunately, because Borders Bookstores went bankrupt in 2011, it closed the 475 Starbucks stores that it had licensed. This caused a net negative growth of 342 licensee closings in 2011 in the United States. Overall revenue again sustained healthy growth, with total revenues reaching 11.7 billion (up 9.3% from 2010). Kim was even more encouraged with Starbucks growth in fiscal 2012. During that period, Starbucks opened a total of 1,063 new stores. Of those, Starbucks opened 234 company-owned and 270 licensed stores in the Americas. In the EMEA region, Starbucks opened 10 company-owned and 101 licensed stores, as well as 154 company-owned and 294 licensed stores in the CAP region. Overall revenue reached 13.3 billion (up 14% from 2011). Starbucks also continues to expand the scope of its business model through new channel development in order to reach customers where they work, travel, shop, and dine. To further expand the business model, Starbucks terminated its licensing and distribution agreement with Kraft Foods and now manages its own marketing and distribution of Starbucks whole bean and ground coffee to grocery stores and warehouse club stores. By the end of fiscal 2012, Star-bucks whole bean and ground coffees were available throughout the United States in approximately 39,000 grocery and warehouse club stores. Further, Starbucks sells whole bean and ground coffee through institutional foodservice companies that service business, education, office, hotel, restaurant, airline, and other foodservice accounts. For example, in 2012 Starbucks (and their subsidiary, Seattles Best Coffee) were the only superpremium national brand coffees promoted by Sysco Corporation to such foodservice accounts. Finally, Starbucks had formed partnerships to produce and distribute bottled Frappuccino and DoubleShot drinks with PepsiCo and premium ice creams with Unilever. Despite Starbucks past difficulties with store closings, restructuring charges, and negative comparable store sales growth rates, Kim could see some very positive aspects of Starbucks financial performance and condition. She noted that Starbucks had been profitable in 2008 and 2009, despite the difficulties. She also noted that Starbucks generated record high profits in 2010, 2011, and 2012, suggesting the restructuring and turnaround efforts were proving successful. The restructuring plan was seemingly complete and had helped Starbucks to reduce costs. Further, she noted that Starbucks operating cash flows had remained fairly strong throughout this period. With its positive operating cash flows, Starbucks had retired all of the 713 million in commercial paper and short-term borrowings during 2009, initiated the first dividend in company history in 2010, resumed repurchasing common shares in 2010, and had grown the combined balances in cash and short-term investments over 2.0 billion by fiscal year-end 2012. Product Supply Starbucks purchases green coffee beans from coffee-producing regions around the world and custom roasts and blends them to its exacting standards. Although coffee beans trade in commodity markets and experience volatile prices, Starbucks purchases higher-quality coffee beans that sell at a premium to commodity coffees. Starbucks purchases its coffee beans under fixed-price purchase contracts with various suppliers, with purchase prices reset annually. Starbucks also purchases significant amounts of dairy products from suppliers located near its retail stores. Starbucks purchases paper and plastic products from several suppliers, the prices of which vary with changes in the prices of commodity paper and plastic resin. Competition in the Specialty Coffee Industry After some reflection, Kim realized that Starbucks faced intense direct competition. Kim could think of a wide array of convenient retail locations where a person can purchase a cup of coffee. Kim reasoned that Starbucks competes with a broad scope of coffee beverage retailers, including fast-food chains (for example, McDonalds), doughnut chains (for example, Krispy Kreme, Dunkin Donuts, and Tim Hortons), and convenience stores associated with many gas stations, but that these types of outlets offer an experience that is very different from what Starbucks offers. In particular, Kim was aware that McDonalds had started to expand development of its McCaf shops, which sold premium coffee drinks (lattes, cappuccinos, and mochas) in McDonalds restaurants. It appeared to Kim that the McCaf initiative was intended to be a direct competitive challenge to Starbucks business. Kim also identified a number of companies that were growing chains of retail coffee shops that could be compared to Starbucks, including firms such as Panera Bread Company; Diedrich Coffee; New World Restaurant Group, Inc.; and Caribou Coffee Company, Inc. (a privately held firm). However, these firms were much smaller than Starbucks, with the largest among them being the Panera Bread Company, with approximately 1,700 bakery-cafs system-wide at the end of 2012. On the other end of the spectrum, Kim was aware that Starbucks faced competition from local independent coffee shops and cafs. Kim recognized that despite facing extensive competition, Starbucks had some distinct competitive advantages. Very few companies were implementing a business strategy comparable to that of Starbucks, with emphasis on the quality of the experience, the products, and the service. In addition, only the fast-food chains and the doughnut chains operated on the same scale as Starbucks. Finally, Starbucks had developed a global brand that was synonymous with the quality of the Starbucks experience. Recently, Interbrand ranked the Starbucks brand as one of the worlds top 100 most valuable brand names, estimating it to be worth in excess of 4 billion. The Valuation Controversy In beginning to research Starbucks share price (ticker: SBUX), Kim realized that it had experienced a wild ride over the past five years, following a very similar pattern to Starbucks earnings performance during that time. Starbucks had been one of the hottest companies in the capital market, in large part due to its impressive growth in sales and earnings, up until December of 2006. SBUXs share price had appreciated dramatically, generating cumulative returns that far exceeded those of the SP 500 over that period. The market for Starbucks shares cooled beginning in early 2007, with share prices falling from a high of nearly 40 to a low of under 8 in November of 2008. Since that low point, Starbucks share price began a dramatic recovery. Over the calendar year 2012, SBUX stock price ranged between 42 and 62 per share, and was currently trading at 50 per share, implying a PE ratio of over 28 (based on trailing 12 months earnings per share of 1.79), an earnings multiple that is well above the industry average. Kim further discovered that the capital markets and analysts have mixed opinions on the SBUX stock value. Kim found one-year-ahead price targets from 24 analysts, ranging from a low of 49 to a high of 65, with a mean (median) price target of 59 (60). She found that 30 analysts issued investment recommendations for SBUX: eleven recommend strong buy, ten recommend buy, nine recommend hold, and no analysts recommend sell. The consensus analysts earnings per share forecasts are 2.15 for fiscal 2013 and 2.62 for fiscal 2014. Financial Statements Exhibit 126 presents comparative balance sheets. Exhibit 1.27 presents comparative income statements, and Exhibit 1.28 (pages 7677) presents comparative statements of cash flows for Starbucks for the four fiscal years ending September 30, 2012. Apply Porters five forces framework to the specialty coffee retail industry.arrow_forwardStarbucks The first case at the end of this chapter and numerous subsequent chapters is a series of integrative cases involving Starbucks. The series of cases applies the concepts and analytical tools discussed in each chapter to Starbucks financial statements and notes. The preparation of responses to the questions in these cases results in an integrated illustration of the six sequential steps in financial statement analysis discussed in this chapter and throughout the book. Introduction They dont just sell coffee; they sell the Starbucks Experience, remarked Deb Mills while sitting down to enjoy a cup of Starbucks cappuccino with her friend Kim Shannon. Kim, an investment fund manager for a large insurance firm, reflected on that observation and what it might mean for Starbucks as a potential investment opportunity. Glancing around the store, Kim saw a number of people sitting alone or in groups, lingering over their drinks while chatting, reading, or checking e-mail and surfing the Internet through the stores wi-fi network. Kim noted that in addition to the wide selection of hot coffees, French and Italian style espressos, teas, and cold coffee-blended drinks, Starbucks also offered food items and baked goods, packages of roasted coffee beans, coffee-related accessories and equipment, and even its own line of CDs. Intrigued, Kim made a mental note to do a full financial statement and valuation analysis of Starbucks to evaluate whether its business model and common equity shares were as good as their coffee. Growth Strategy Kims research quickly confirmed her friends observation that Starbucks is about the experience of enjoying a good cup of coffee. The Starbucks 2012 Form 10-K (page 3) asserts the following: Our retail objective is to be the leading retailer and brand of coffee in each of our target markets by selling the finest quality coffee and related products, and by providing each customer a unique Starbucks Experience. The Starbucks Experience is built upon superior customer service as well as clean and well-maintained company operated stores that reflect the personalities of the communities in which they operate, thereby building a high degree of customer loyalty. The Starbucks experience strives to create a third placesomewhere besides home and work where a customer can feel comfortable and welcomethrough friendly and skilled customer service in clean and personable retail store environments. This approach enabled Starbucks to grow rapidly from just a single store near Pikes Place Market in Seattle to a global company with 18,066 locations worldwide at the end of fiscal 2012. Of that total, Starbucks owned and operated 9,405 stores (7,857 stores in the Americas; 882 stores in the Europe, Middle East Africa (EMEA) region; and 666 stores in the China and Asia Pacific (CAP) region). In addition, licensees owned and operated a total of 8,661 stores (5,046 stores in the Americas; 987 stores in the EMEA region; and 2,628 stores in the CAP region). Most of Starbucks stores at the end of fiscal 2012 were located in the United States, amounting to one Starbucks retail location for every 28,000 U.S. residents. However, Starbucks was clearly not a company content to focus simply on the U.S. market, as it was extending the reach of its stores globally, with thousands of stores outside the United States. At the end of fiscal 2012, Starbucks owned and operated stores in a number of countries around the world, including 878 stores in Canada, 593 stores in the United Kingdom, and 408 stores in China. Starbucks success can be attributed in part to its successful development and expansion of a European ideaenjoying a fine coffee-based beverage and sharing that experience with others in a comfortable, friendly environment with pleasant, competent service. Starbucks imported the idea of the French and Italian caf into the busy North American lifestyle. Ironically, Starbucks successfully extended its brand and style of a caf into the European continent. On January 16, 2004, Starbucks opened its first coffeehouse in Francein the heart of Paris at 26 Avenue de IOperaand had a total of 67 stores in France by the end of 2012. The success of Starbucks retail coffeehouse concept is illustrated by the fact that by the end of 2012, Star-bucks had opened over 1,100 company-operated and licensed locations in Europe, with the majority of them in the United Kingdom. Not long ago, Starbucks CEO Howard Schultz stated that his vision and ultimate goal for Starbucks was to have 20,000 Starbucks retail locations in the United States, to have another 20,000 retail locations in international markets worldwide, and to have Starbucks recognized among the worlds leading brands. Kim Shannon wondered whether Starbucks could ultimately achieve that level of global penetration because she could name only a few such worldwide companies. Among those that came to mind were McDonalds, with more than 34,000 retail locations in 118 countries; Subway, with more than 34,000 locations in 90 countries; and Yum! Brands, with more than 40,000 restaurants in 130 countries under brand names such as KFC, Pizza Hut, and Taco Bell. Growth in the number of retail stores had been one of the primary drivers of Starbucks growth in revenues. The most significant area of expansion of the Starbucks model in recent years has been the rapid growth in the number of licensed retail stores. At the end of fiscal 1999, Starbucks had only 363 licensed stores, but by the end of fiscal 2012, the number of licensed stores had mushroomed to 8,661. Recent Performance Performance in recent years caused Kim to question whether Starbucks had already reached (or perhaps exceeded) its full potential. She wondered whether it could generate the impressive growth in new stores and revenues that it had created in the past. In fiscal year 2008, Starbucks opened 1,669 net new retail locations (698 net new company-owned stores and 971 new licensed stores), but this number was well below the initial target of 2,500 new stores and well below the 2,571 new stores opened in 2007. Late in 2008, Starbucks announced a plan to close approximately 600 underperforming stores in the United States as well as 64 underperforming stores in Australia. The store closings triggered restructuring charges that reduced Starbucks operating income by 266.9 million in 2008. During fiscal 2009, they increased the restructuring plan to close a total of approximately 800 U.S. stores (an increase of 200), and managed to close 566 U.S. stores during the year. They also announced a plan to close 100 stores in various international markets. The 2009 store closings triggered additional restructuring charges that reduced Starbucks operating income by 332.4 million in 2009. In 2009, for the first time in company history, Starbucks net store growth was negative, with a net of 474 stores closed in the United States (92 stores opened net of 566 closed) and only 89 net new international stores opened (130 stores opened net of 41 closed), for a net total closure of 385 company operated stores. In fiscal 2009, total revenues fell to 9,775 billion from 10,383 billion in fiscal 2008. Fiscal 2009 marked the first year of revenue decline (5.9%) in company history. Prior to 2009, Star-bucks had generated impressive revenue growth rates of 10.3% in fiscal 2008; 20.9% growth in fiscal 2007; and 22.2% in fiscal 2006. Starbucks revenue growth is not just driven by opening new stores; it is also driven by sales growth among existing stores. Through 2007, Starbucks could boast of a streak of 16 consecutive years in which it achieved comparable store sales growth rates equal to or greater than 5%, but that string was broken with negative 3% comparable store sales growth in 2008. Unfortunately, things got worse in 2009, because Starbucks company-operated stores generated a negative 6% growth in comparable U.S. store sales, a negative 2% growth in comparable international store sales, and a negative 6% growth in comparable store sales overall. In response to the downturn in Starbucks business, in January, 2009, Howard Schultz returned from retirement and reassumed his role as president and CEO of Starbucks in order to restructure the business and its potential for growth. Focal points of his transformation plan included taking a more disciplined approach to new store openings, reinvigorating the Star-bucks Experience, developing and implementing even better service and quality, while cutting operating and overhead costs. In addition, the transformation plans included introducing more new beverage and food offerings, such as baked goods, breakfast items and chilled and other foods. A key to Starbucks profit growth lies in increasing same store sales growth via new products. Starbucks regularly introduces new specialty coffee-based drinks and coffee flavors, as well as iced coffee-based drinks, such as the very successful line of Frappuccino drinks and Shaken Iced Refreshment drinks. Under Schultzs renewed leadership, comparable store sales growth rebounded impressively, to 7% growth among U.S. stores and 6% among international stores. Starbucks store openings were very conservative in 2010, owing in part to the difficult economic conditions in the primary markets. In the United States, Starbucks only opened a net 3 new stores in 2010opening 60 licensed stores while closing 57 company-owned stores. Internationally, Star-bucks opened 220 new stores in 2010opening 235 licensed stores while closing 15 company-owned stores. Overall revenue growth also rebounded, reaching 10.7 billion (up 9.5% from 2009). Starbucks continued this modest new store growth trajectory into 2011. Among company-owned stores, Starbucks opened 49 but closed 51 in the United States and opened 180 but closed 36 international stores. Starbucks licensees opened 345 new stores internationally and 133 new stores in the United States. Unfortunately, because Borders Bookstores went bankrupt in 2011, it closed the 475 Starbucks stores that it had licensed. This caused a net negative growth of 342 licensee closings in 2011 in the United States. Overall revenue again sustained healthy growth, with total revenues reaching 11.7 billion (up 9.3% from 2010). Kim was even more encouraged with Starbucks growth in fiscal 2012. During that period, Starbucks opened a total of 1,063 new stores. Of those, Starbucks opened 234 company-owned and 270 licensed stores in the Americas. In the EMEA region, Starbucks opened 10 company-owned and 101 licensed stores, as well as 154 company-owned and 294 licensed stores in the CAP region. Overall revenue reached 13.3 billion (up 14% from 2011). Starbucks also continues to expand the scope of its business model through new channel development in order to reach customers where they work, travel, shop, and dine. To further expand the business model, Starbucks terminated its licensing and distribution agreement with Kraft Foods and now manages its own marketing and distribution of Starbucks whole bean and ground coffee to grocery stores and warehouse club stores. By the end of fiscal 2012, Star-bucks whole bean and ground coffees were available throughout the United States in approximately 39,000 grocery and warehouse club stores. Further, Starbucks sells whole bean and ground coffee through institutional foodservice companies that service business, education, office, hotel, restaurant, airline, and other foodservice accounts. For example, in 2012 Starbucks (and their subsidiary, Seattles Best Coffee) were the only superpremium national brand coffees promoted by Sysco Corporation to such foodservice accounts. Finally, Starbucks had formed partnerships to produce and distribute bottled Frappuccino and DoubleShot drinks with PepsiCo and premium ice creams with Unilever. Despite Starbucks past difficulties with store closings, restructuring charges, and negative comparable store sales growth rates, Kim could see some very positive aspects of Starbucks financial performance and condition. She noted that Starbucks had been profitable in 2008 and 2009, despite the difficulties. She also noted that Starbucks generated record high profits in 2010, 2011, and 2012, suggesting the restructuring and turnaround efforts were proving successful. The restructuring plan was seemingly complete and had helped Starbucks to reduce costs. Further, she noted that Starbucks operating cash flows had remained fairly strong throughout this period. With its positive operating cash flows, Starbucks had retired all of the 713 million in commercial paper and short-term borrowings during 2009, initiated the first dividend in company history in 2010, resumed repurchasing common shares in 2010, and had grown the combined balances in cash and short-term investments over 2.0 billion by fiscal year-end 2012. Product Supply Starbucks purchases green coffee beans from coffee-producing regions around the world and custom roasts and blends them to its exacting standards. Although coffee beans trade in commodity markets and experience volatile prices, Starbucks purchases higher-quality coffee beans that sell at a premium to commodity coffees. Starbucks purchases its coffee beans under fixed-price purchase contracts with various suppliers, with purchase prices reset annually. Starbucks also purchases significant amounts of dairy products from suppliers located near its retail stores. Starbucks purchases paper and plastic products from several suppliers, the prices of which vary with changes in the prices of commodity paper and plastic resin. Competition in the Specialty Coffee Industry After some reflection, Kim realized that Starbucks faced intense direct competition. Kim could think of a wide array of convenient retail locations where a person can purchase a cup of coffee. Kim reasoned that Starbucks competes with a broad scope of coffee beverage retailers, including fast-food chains (for example, McDonalds), doughnut chains (for example, Krispy Kreme, Dunkin Donuts, and Tim Hortons), and convenience stores associated with many gas stations, but that these types of outlets offer an experience that is very different from what Starbucks offers. In particular, Kim was aware that McDonald's had started to expand development of its McCaf shops, which sold premium coffee drinks (lattes, cappuccinos, and mochas) in McDonalds restaurants. It appeared to Kim that the McCaf initiative was intended to be a direct competitive challenge to Starbucks business. Kim also identified a number of companies that were growing chains of retail coffee shops that could be compared to Starbucks, including firms such as Panera Bread Company; Diedrich Coffee; New World Restaurant Group, Inc.; and Caribou Coffee Company, Inc. (a privately held firm). However, these firms were much smaller than Starbucks, with the largest among them being the Panera Bread Company, with approximately 1,700 bakery-cafs system-wide at the end of 2012. On the other end of the spectrum, Kim was aware that Starbucks faced competition from local independent coffee shops and cafs. Kim recognized that despite facing extensive competition, Starbucks had some distinct competitive advantages. Very few companies were implementing a business strategy comparable to that of Starbucks, with emphasis on the quality of the experience, the products, and the service. In addition, only the fast-food chains and the doughnut chains operated on the same scale as Starbucks. Finally, Starbucks had developed a global brand that was synonymous with the quality of the Starbucks experience. Recently, Interbrand ranked the Starbucks brand as one of the worlds top 100 most valuable brand names, estimating it to be worth in excess of 4 billion. The Valuation Controversy In beginning to research Starbucks share price (ticker: SBUX), Kim realized that it had experienced a wild ride over the past five years, following a very similar pattern to Starbucks earnings performance during that time. Starbucks had been one of the hottest companies in the capital market, in large part due to its impressive growth in sales and earnings, up until December of 2006. SBUXs share price had appreciated dramatically, generating cumulative returns that far exceeded those of the SP 500 over that period. The market for Starbucks shares cooled beginning in early 2007, with share prices falling from a high of nearly 40 to a low of under 8 in November of 2008. Since that low point, Starbucks share price began a dramatic recovery. Over the calendar year 2012, SBUX stock price ranged between 42 and 62 per share, and was currently trading at 50 per share, implying a PE ratio of over 28 (based on trailing 12 months earnings per share of 1.79), an earnings multiple that is well above the industry average. Kim further discovered that the capital markets and analysts have mixed opinions on the SBUX stock value. Kim found one-year-ahead price targets from 24 analysts, ranging from a low of 49 to a high of 65, with a mean (median) price target of 59 (60). She found that 30 analysts issued investment recommendations for SBUX: eleven recommend strong buy, ten recommend buy, nine recommend hold, and no analysts recommend sell. The consensus analysts earnings per share forecasts are 2.15 for fiscal 2013 and 2.62 for fiscal 2014. Financial Statements Exhibit 126 presents comparative balance sheets. Exhibit 1.27 presents comparative income statements, and Exhibit 1.28 (pages 7677) presents comparative statements of cash flows for Starbucks for the four fiscal years ending September 30, 2012. The dollar amount shown for cash and cash equivalents (see Exhibit 1.26) increased between the end of fiscal 2011 and the end of fiscal 2012, yet the percentage of total assets comprising these assets declined (see Exhibit 1.29). Explain.arrow_forward
- Starbucks The first case at the end of this chapter and numerous subsequent chapters is a series of integrative cases involving Starbucks. The series of cases applies the concepts and analytical tools discussed in each chapter to Starbucks financial statements and notes. The preparation of responses to the questions in these cases results in an integrated illustration of the six sequential steps in financial statement analysis discussed in this chapter and throughout the book. Introduction They dont just sell coffee; they sell the Starbucks Experience, remarked Deb Mills while sitting down to enjoy a cup of Starbucks cappuccino with her friend Kim Shannon. Kim, an investment fund manager for a large insurance firm, reflected on that observation and what it might mean for Starbucks as a potential investment opportunity. Glancing around the store, Kim saw a number of people sitting alone or in groups, lingering over their drinks while chatting, reading, or checking e-mail and surfing the Internet through the stores wi-fi network. Kim noted that in addition to the wide selection of hot coffees, French and Italian style espressos, teas, and cold coffee-blended drinks, Starbucks also offered food items and baked goods, packages of roasted coffee beans, coffee-related accessories and equipment, and even its own line of CDs. Intrigued, Kim made a mental note to do a full financial statement and valuation analysis of Starbucks to evaluate whether its business model and common equity shares were as good as their coffee. Growth Strategy Kims research quickly confirmed her friends observation that Starbucks is about the experience of enjoying a good cup of coffee. The Starbucks 2012 Form 10-K (page 3) asserts the following: Our retail objective is to be the leading retailer and brand of coffee in each of our target markets by selling the finest quality coffee and related products, and by providing each customer a unique Starbucks Experience. The Starbucks Experience is built upon superior customer service as well as clean and well-maintained company operated stores that reflect the personalities of the communities in which they operate, thereby building a high degree of customer loyalty. The Starbucks experience strives to create a third placesomewhere besides home and work where a customer can feel comfortable and welcomethrough friendly and skilled customer service in clean and personable retail store environments. This approach enabled Starbucks to grow rapidly from just a single store near Pikes Place Market in Seattle to a global company with 18,066 locations worldwide at the end of fiscal 2012. Of that total, Starbucks owned and operated 9,405 stores (7,857 stores in the Americas; 882 stores in the Europe, Middle East Africa (EMEA) region; and 666 stores in the China and Asia Pacific (CAP) region). In addition, licensees owned and operated a total of 8,661 stores (5,046 stores in the Americas; 987 stores in the EMEA region; and 2,628 stores in the CAP region). Most of Starbucks stores at the end of fiscal 2012 were located in the United States, amounting to one Starbucks retail location for every 28,000 U.S. residents. However, Starbucks was clearly not a company content to focus simply on the U.S. market, as it was extending the reach of its stores globally, with thousands of stores outside the United States. At the end of fiscal 2012, Starbucks owned and operated stores in a number of countries around the world, including 878 stores in Canada, 593 stores in the United Kingdom, and 408 stores in China. Starbucks success can be attributed in part to its successful development and expansion of a European ideaenjoying a fine coffee-based beverage and sharing that experience with others in a comfortable, friendly environment with pleasant, competent service. Starbucks imported the idea of the French and Italian caf into the busy North American lifestyle. Ironically, Starbucks successfully extended its brand and style of a caf into the European continent. On January 16, 2004, Starbucks opened its first coffeehouse in Francein the heart of Paris at 26 Avenue de IOperaand had a total of 67 stores in France by the end of 2012. The success of Starbucks retail coffeehouse concept is illustrated by the fact that by the end of 2012, Star-bucks had opened over 1,100 company-operated and licensed locations in Europe, with the majority of them in the United Kingdom. Not long ago, Starbucks CEO Howard Schultz stated that his vision and ultimate goal for Starbucks was to have 20,000 Starbucks retail locations in the United States, to have another 20,000 retail locations in international markets worldwide, and to have Starbucks recognized among the worlds leading brands. Kim Shannon wondered whether Starbucks could ultimately achieve that level of global penetration because she could name only a few such worldwide companies. Among those that came to mind were McDonalds, with more than 34,000 retail locations in 118 countries; Subway, with more than 34,000 locations in 90 countries; and Yum! Brands, with more than 40,000 restaurants in 130 countries under brand names such as KFC, Pizza Hut, and Taco Bell. Growth in the number of retail stores had been one of the primary drivers of Starbucks growth in revenues. The most significant area of expansion of the Starbucks model in recent years has been the rapid growth in the number of licensed retail stores. At the end of fiscal 1999, Starbucks had only 363 licensed stores, but by the end of fiscal 2012, the number of licensed stores had mushroomed to 8,661. Recent Performance Performance in recent years caused Kim to question whether Starbucks had already reached (or perhaps exceeded) its full potential. She wondered whether it could generate the impressive growth in new stores and revenues that it had created in the past. In fiscal year 2008, Starbucks opened 1,669 net new retail locations (698 net new company-owned stores and 971 new licensed stores), but this number was well below the initial target of 2,500 new stores and well below the 2,571 new stores opened in 2007. Late in 2008, Starbucks announced a plan to close approximately 600 underperforming stores in the United States as well as 64 underperforming stores in Australia. The store closings triggered restructuring charges that reduced Starbucks operating income by 266.9 million in 2008. During fiscal 2009, they increased the restructuring plan to close a total of approximately 800 U.S. stores (an increase of 200), and managed to close 566 U.S. stores during the year. They also announced a plan to close 100 stores in various international markets. The 2009 store closings triggered additional restructuring charges that reduced Starbucks operating income by 332.4 million in 2009. In 2009, for the first time in company history, Starbucks net store growth was negative, with a net of 474 stores closed in the United States (92 stores opened net of 566 closed) and only 89 net new international stores opened (130 stores opened net of 41 closed), for a net total closure of 385 company operated stores. In fiscal 2009, total revenues fell to 9,775 billion from 10,383 billion in fiscal 2008. Fiscal 2009 marked the first year of revenue decline (5.9%) in company history. Prior to 2009, Star-bucks had generated impressive revenue growth rates of 10.3% in fiscal 2008; 20.9% growth in fiscal 2007; and 22.2% in fiscal 2006. Starbucks revenue growth is not just driven by opening new stores; it is also driven by sales growth among existing stores. Through 2007, Starbucks could boast of a streak of 16 consecutive years in which it achieved comparable store sales growth rates equal to or greater than 5%, but that string was broken with negative 3% comparable store sales growth in 2008. Unfortunately, things got worse in 2009, because Starbucks company-operated stores generated a negative 6% growth in comparable U.S. store sales, a negative 2% growth in comparable international store sales, and a negative 6% growth in comparable store sales overall. In response to the downturn in Starbucks business, in January, 2009, Howard Schultz returned from retirement and reassumed his role as president and CEO of Starbucks in order to restructure the business and its potential for growth. Focal points of his transformation plan included taking a more disciplined approach to new store openings, reinvigorating the Star-bucks Experience, developing and implementing even better service and quality, while cutting operating and overhead costs. In addition, the transformation plans included introducing more new beverage and food offerings, such as baked goods, breakfast items and chilled and other foods. A key to Starbucks profit growth lies in increasing same store sales growth via new products. Starbucks regularly introduces new specialty coffee-based drinks and coffee flavors, as well as iced coffee-based drinks, such as the very successful line of Frappuccino drinks and Shaken Iced Refreshment drinks. Under Schultzs renewed leadership, comparable store sales growth rebounded impressively, to 7% growth among U.S. stores and 6% among international stores. Starbucks store openings were very conservative in 2010, owing in part to the difficult economic conditions in the primary markets. In the United States, Starbucks only opened a net 3 new stores in 2010opening 60 licensed stores while closing 57 company-owned stores. Internationally, Star-bucks opened 220 new stores in 2010opening 235 licensed stores while closing 15 company-owned stores. Overall revenue growth also rebounded, reaching 10.7 billion (up 9.5% from 2009). Starbucks continued this modest new store growth trajectory into 2011. Among company-owned stores, Starbucks opened 49 but closed 51 in the United States and opened 180 but closed 36 international stores. Starbucks licensees opened 345 new stores internationally and 133 new stores in the United States. Unfortunately, because Borders Bookstores went bankrupt in 2011, it closed the 475 Starbucks stores that it had licensed. This caused a net negative growth of 342 licensee closings in 2011 in the United States. Overall revenue again sustained healthy growth, with total revenues reaching 11.7 billion (up 9.3% from 2010). Kim was even more encouraged with Starbucks growth in fiscal 2012. During that period, Starbucks opened a total of 1,063 new stores. Of those, Starbucks opened 234 company-owned and 270 licensed stores in the Americas. In the EMEA region, Starbucks opened 10 company-owned and 101 licensed stores, as well as 154 company-owned and 294 licensed stores in the CAP region. Overall revenue reached 13.3 billion (up 14% from 2011). Starbucks also continues to expand the scope of its business model through new channel development in order to reach customers where they work, travel, shop, and dine. To further expand the business model, Starbucks terminated its licensing and distribution agreement with Kraft Foods and now manages its own marketing and distribution of Starbucks whole bean and ground coffee to grocery stores and warehouse club stores. By the end of fiscal 2012, Star-bucks whole bean and ground coffees were available throughout the United States in approximately 39,000 grocery and warehouse club stores. Further, Starbucks sells whole bean and ground coffee through institutional foodservice companies that service business, education, office, hotel, restaurant, airline, and other foodservice accounts. For example, in 2012 Starbucks (and their subsidiary, Seattles Best Coffee) were the only superpremium national brand coffees promoted by Sysco Corporation to such foodservice accounts. Finally, Starbucks had formed partnerships to produce and distribute bottled Frappuccino and DoubleShot drinks with PepsiCo and premium ice creams with Unilever. Despite Starbucks past difficulties with store closings, restructuring charges, and negative comparable store sales growth rates, Kim could see some very positive aspects of Starbucks financial performance and condition. She noted that Starbucks had been profitable in 2008 and 2009, despite the difficulties. She also noted that Starbucks generated record high profits in 2010, 2011, and 2012, suggesting the restructuring and turnaround efforts were proving successful. The restructuring plan was seemingly complete and had helped Starbucks to reduce costs. Further, she noted that Starbucks operating cash flows had remained fairly strong throughout this period. With its positive operating cash flows, Starbucks had retired all of the 713 million in commercial paper and short-term borrowings during 2009, initiated the first dividend in company history in 2010, resumed repurchasing common shares in 2010, and had grown the combined balances in cash and short-term investments over 2.0 billion by fiscal year-end 2012. Product Supply Starbucks purchases green coffee beans from coffee-producing regions around the world and custom roasts and blends them to its exacting standards. Although coffee beans trade in commodity markets and experience volatile prices, Starbucks purchases higher-quality coffee beans that sell at a premium to commodity coffees. Starbucks purchases its coffee beans under fixed-price purchase contracts with various suppliers, with purchase prices reset annually. Starbucks also purchases significant amounts of dairy products from suppliers located near its retail stores. Starbucks purchases paper and plastic products from several suppliers, the prices of which vary with changes in the prices of commodity paper and plastic resin. Competition in the Specialty Coffee Industry After some reflection, Kim realized that Starbucks faced intense direct competition. Kim could think of a wide array of convenient retail locations where a person can purchase a cup of coffee. Kim reasoned that Starbucks competes with a broad scope of coffee beverage retailers, including fast-food chains (for example, McDonalds), doughnut chains (for example, Krispy Kreme, Dunkin Donuts, and Tim Hortons), and convenience stores associated with many gas stations, but that these types of outlets offer an experience that is very different from what Starbucks offers. In particular, Kim was aware that McDonald's had started to expand development of its McCaf shops, which sold premium coffee drinks (lattes, cappuccinos, and mochas) in McDonalds restaurants. It appeared to Kim that the McCaf initiative was intended to be a direct competitive challenge to Starbucks business. Kim also identified a number of companies that were growing chains of retail coffee shops that could be compared to Starbucks, including firms such as Panera Bread Company; Diedrich Coffee; New World Restaurant Group, Inc.; and Caribou Coffee Company, Inc. (a privately held firm). However, these firms were much smaller than Starbucks, with the largest among them being the Panera Bread Company, with approximately 1,700 bakery-cafs system-wide at the end of 2012. On the other end of the spectrum, Kim was aware that Starbucks faced competition from local independent coffee shops and cafs. Kim recognized that despite facing extensive competition, Starbucks had some distinct competitive advantages. Very few companies were implementing a business strategy comparable to that of Starbucks, with emphasis on the quality of the experience, the products, and the service. In addition, only the fast-food chains and the doughnut chains operated on the same scale as Starbucks. Finally, Starbucks had developed a global brand that was synonymous with the quality of the Starbucks experience. Recently, Interbrand ranked the Starbucks brand as one of the worlds top 100 most valuable brand names, estimating it to be worth in excess of 4 billion. The Valuation Controversy In beginning to research Starbucks share price (ticker: SBUX), Kim realized that it had experienced a wild ride over the past five years, following a very similar pattern to Starbucks earnings performance during that time. Starbucks had been one of the hottest companies in the capital market, in large part due to its impressive growth in sales and earnings, up until December of 2006. SBUXs share price had appreciated dramatically, generating cumulative returns that far exceeded those of the SP 500 over that period. The market for Starbucks shares cooled beginning in early 2007, with share prices falling from a high of nearly 40 to a low of under 8 in November of 2008. Since that low point, Starbucks share price began a dramatic recovery. Over the calendar year 2012, SBUX stock price ranged between 42 and 62 per share, and was currently trading at 50 per share, implying a PE ratio of over 28 (based on trailing 12 months earnings per share of 1.79), an earnings multiple that is well above the industry average. Kim further discovered that the capital markets and analysts have mixed opinions on the SBUX stock value. Kim found one-year-ahead price targets from 24 analysts, ranging from a low of 49 to a high of 65, with a mean (median) price target of 59 (60). She found that 30 analysts issued investment recommendations for SBUX: eleven recommend strong buy, ten recommend buy, nine recommend hold, and no analysts recommend sell. The consensus analysts earnings per share forecasts are 2.15 for fiscal 2013 and 2.62 for fiscal 2014. Financial Statements Exhibit 126 presents comparative balance sheets. Exhibit 1.27 presents comparative income statements, and Exhibit 1.28 (pages 7677) presents comparative statements of cash flows for Starbucks for the four fiscal years ending September 30, 2012. Starbucks reports three principal sources of revenues: (1) company-operated stores, (2) licensing, and (3) foodservice and other consumer products. Using the narrative information provided in this case, describe the nature of each of these three sources of revenue.arrow_forwardStarbucks The first case at the end of this chapter and numerous subsequent chapters is a series of integrative cases involving Starbucks. The series of cases applies the concepts and analytical tools discussed in each chapter to Starbucks financial statements and notes. The preparation of responses to the questions in these cases results in an integrated illustration of the six sequential steps in financial statement analysis discussed in this chapter and throughout the book. Introduction They dont just sell coffee; they sell the Starbucks Experience, remarked Deb Mills while sitting down to enjoy a cup of Starbucks cappuccino with her friend Kim Shannon. Kim, an investment fund manager for a large insurance firm, reflected on that observation and what it might mean for Starbucks as a potential investment opportunity. Glancing around the store, Kim saw a number of people sitting alone or in groups, lingering over their drinks while chatting, reading, or checking e-mail and surfing the Internet through the stores wi-fi network. Kim noted that in addition to the wide selection of hot coffees, French and Italian style espressos, teas, and cold coffee-blended drinks, Starbucks also offered food items and baked goods, packages of roasted coffee beans, coffee-related accessories and equipment, and even its own line of CDs. Intrigued, Kim made a mental note to do a full financial statement and valuation analysis of Starbucks to evaluate whether its business model and common equity shares were as good as their coffee. Growth Strategy Kims research quickly confirmed her friends observation that Starbucks is about the experience of enjoying a good cup of coffee. The Starbucks 2012 Form 10-K (page 3) asserts the following: Our retail objective is to be the leading retailer and brand of coffee in each of our target markets by selling the finest quality coffee and related products, and by providing each customer a unique Starbucks Experience. The Starbucks Experience is built upon superior customer service as well as clean and well-maintained company operated stores that reflect the personalities of the communities in which they operate, thereby building a high degree of customer loyalty. The Starbucks experience strives to create a third placesomewhere besides home and work where a customer can feel comfortable and welcomethrough friendly and skilled customer service in clean and personable retail store environments. This approach enabled Starbucks to grow rapidly from just a single store near Pikes Place Market in Seattle to a global company with 18,066 locations worldwide at the end of fiscal 2012. Of that total, Starbucks owned and operated 9,405 stores (7,857 stores in the Americas; 882 stores in the Europe, Middle East Africa (EMEA) region; and 666 stores in the China and Asia Pacific (CAP) region). In addition, licensees owned and operated a total of 8,661 stores (5,046 stores in the Americas; 987 stores in the EMEA region; and 2,628 stores in the CAP region). Most of Starbucks stores at the end of fiscal 2012 were located in the United States, amounting to one Starbucks retail location for every 28,000 U.S. residents. However, Starbucks was clearly not a company content to focus simply on the U.S. market, as it was extending the reach of its stores globally, with thousands of stores outside the United States. At the end of fiscal 2012, Starbucks owned and operated stores in a number of countries around the world, including 878 stores in Canada, 593 stores in the United Kingdom, and 408 stores in China. Starbucks success can be attributed in part to its successful development and expansion of a European ideaenjoying a fine coffee-based beverage and sharing that experience with others in a comfortable, friendly environment with pleasant, competent service. Starbucks imported the idea of the French and Italian caf into the busy North American lifestyle. Ironically, Starbucks successfully extended its brand and style of a caf into the European continent. On January 16, 2004, Starbucks opened its first coffeehouse in Francein the heart of Paris at 26 Avenue de IOperaand had a total of 67 stores in France by the end of 2012. The success of Starbucks retail coffeehouse concept is illustrated by the fact that by the end of 2012, Star-bucks had opened over 1,100 company-operated and licensed locations in Europe, with the majority of them in the United Kingdom. Not long ago, Starbucks CEO Howard Schultz stated that his vision and ultimate goal for Starbucks was to have 20,000 Starbucks retail locations in the United States, to have another 20,000 retail locations in international markets worldwide, and to have Starbucks recognized among the worlds leading brands. Kim Shannon wondered whether Starbucks could ultimately achieve that level of global penetration because she could name only a few such worldwide companies. Among those that came to mind were McDonalds, with more than 34,000 retail locations in 118 countries; Subway, with more than 34,000 locations in 90 countries; and Yum! Brands, with more than 40,000 restaurants in 130 countries under brand names such as KFC, Pizza Hut, and Taco Bell. Growth in the number of retail stores had been one of the primary drivers of Starbucks growth in revenues. The most significant area of expansion of the Starbucks model in recent years has been the rapid growth in the number of licensed retail stores. At the end of fiscal 1999, Starbucks had only 363 licensed stores, but by the end of fiscal 2012, the number of licensed stores had mushroomed to 8,661. Recent Performance Performance in recent years caused Kim to question whether Starbucks had already reached (or perhaps exceeded) its full potential. She wondered whether it could generate the impressive growth in new stores and revenues that it had created in the past. In fiscal year 2008, Starbucks opened 1,669 net new retail locations (698 net new company-owned stores and 971 new licensed stores), but this number was well below the initial target of 2,500 new stores and well below the 2,571 new stores opened in 2007. Late in 2008, Starbucks announced a plan to close approximately 600 underperforming stores in the United States as well as 64 underperforming stores in Australia. The store closings triggered restructuring charges that reduced Starbucks operating income by 266.9 million in 2008. During fiscal 2009, they increased the restructuring plan to close a total of approximately 800 U.S. stores (an increase of 200), and managed to close 566 U.S. stores during the year. They also announced a plan to close 100 stores in various international markets. The 2009 store closings triggered additional restructuring charges that reduced Starbucks operating income by 332.4 million in 2009. In 2009, for the first time in company history, Starbucks net store growth was negative, with a net of 474 stores closed in the United States (92 stores opened net of 566 closed) and only 89 net new international stores opened (130 stores opened net of 41 closed), for a net total closure of 385 company operated stores. In fiscal 2009, total revenues fell to 9,775 billion from 10,383 billion in fiscal 2008. Fiscal 2009 marked the first year of revenue decline (5.9%) in company history. Prior to 2009, Star-bucks had generated impressive revenue growth rates of 10.3% in fiscal 2008; 20.9% growth in fiscal 2007; and 22.2% in fiscal 2006. Starbucks revenue growth is not just driven by opening new stores; it is also driven by sales growth among existing stores. Through 2007, Starbucks could boast of a streak of 16 consecutive years in which it achieved comparable store sales growth rates equal to or greater than 5%, but that string was broken with negative 3% comparable store sales growth in 2008. Unfortunately, things got worse in 2009, because Starbucks company-operated stores generated a negative 6% growth in comparable U.S. store sales, a negative 2% growth in comparable international store sales, and a negative 6% growth in comparable store sales overall. In response to the downturn in Starbucks business, in January, 2009, Howard Schultz returned from retirement and reassumed his role as president and CEO of Starbucks in order to restructure the business and its potential for growth. Focal points of his transformation plan included taking a more disciplined approach to new store openings, reinvigorating the Star-bucks Experience, developing and implementing even better service and quality, while cutting operating and overhead costs. In addition, the transformation plans included introducing more new beverage and food offerings, such as baked goods, breakfast items and chilled and other foods. A key to Starbucks profit growth lies in increasing same store sales growth via new products. Starbucks regularly introduces new specialty coffee-based drinks and coffee flavors, as well as iced coffee-based drinks, such as the very successful line of Frappuccino drinks and Shaken Iced Refreshment drinks. Under Schultzs renewed leadership, comparable store sales growth rebounded impressively, to 7% growth among U.S. stores and 6% among international stores. Starbucks store openings were very conservative in 2010, owing in part to the difficult economic conditions in the primary markets. In the United States, Starbucks only opened a net 3 new stores in 2010opening 60 licensed stores while closing 57 company-owned stores. Internationally, Star-bucks opened 220 new stores in 2010opening 235 licensed stores while closing 15 company-owned stores. Overall revenue growth also rebounded, reaching 10.7 billion (up 9.5% from 2009). Starbucks continued this modest new store growth trajectory into 2011. Among company-owned stores, Starbucks opened 49 but closed 51 in the United States and opened 180 but closed 36 international stores. Starbucks licensees opened 345 new stores internationally and 133 new stores in the United States. Unfortunately, because Borders Bookstores went bankrupt in 2011, it closed the 475 Starbucks stores that it had licensed. This caused a net negative growth of 342 licensee closings in 2011 in the United States. Overall revenue again sustained healthy growth, with total revenues reaching 11.7 billion (up 9.3% from 2010). Kim was even more encouraged with Starbucks growth in fiscal 2012. During that period, Starbucks opened a total of 1,063 new stores. Of those, Starbucks opened 234 company-owned and 270 licensed stores in the Americas. In the EMEA region, Starbucks opened 10 company-owned and 101 licensed stores, as well as 154 company-owned and 294 licensed stores in the CAP region. Overall revenue reached 13.3 billion (up 14% from 2011). Starbucks also continues to expand the scope of its business model through new channel development in order to reach customers where they work, travel, shop, and dine. To further expand the business model, Starbucks terminated its licensing and distribution agreement with Kraft Foods and now manages its own marketing and distribution of Starbucks whole bean and ground coffee to grocery stores and warehouse club stores. By the end of fiscal 2012, Star-bucks whole bean and ground coffees were available throughout the United States in approximately 39,000 grocery and warehouse club stores. Further, Starbucks sells whole bean and ground coffee through institutional foodservice companies that service business, education, office, hotel, restaurant, airline, and other foodservice accounts. For example, in 2012 Starbucks (and their subsidiary, Seattles Best Coffee) were the only superpremium national brand coffees promoted by Sysco Corporation to such foodservice accounts. Finally, Starbucks had formed partnerships to produce and distribute bottled Frappuccino and DoubleShot drinks with PepsiCo and premium ice creams with Unilever. Despite Starbucks past difficulties with store closings, restructuring charges, and negative comparable store sales growth rates, Kim could see some very positive aspects of Starbucks financial performance and condition. She noted that Starbucks had been profitable in 2008 and 2009, despite the difficulties. She also noted that Starbucks generated record high profits in 2010, 2011, and 2012, suggesting the restructuring and turnaround efforts were proving successful. The restructuring plan was seemingly complete and had helped Starbucks to reduce costs. Further, she noted that Starbucks operating cash flows had remained fairly strong throughout this period. With its positive operating cash flows, Starbucks had retired all of the 713 million in commercial paper and short-term borrowings during 2009, initiated the first dividend in company history in 2010, resumed repurchasing common shares in 2010, and had grown the combined balances in cash and short-term investments over 2.0 billion by fiscal year-end 2012. Product Supply Starbucks purchases green coffee beans from coffee-producing regions around the world and custom roasts and blends them to its exacting standards. Although coffee beans trade in commodity markets and experience volatile prices, Starbucks purchases higher-quality coffee beans that sell at a premium to commodity coffees. Starbucks purchases its coffee beans under fixed-price purchase contracts with various suppliers, with purchase prices reset annually. Starbucks also purchases significant amounts of dairy products from suppliers located near its retail stores. Starbucks purchases paper and plastic products from several suppliers, the prices of which vary with changes in the prices of commodity paper and plastic resin. Competition in the Specialty Coffee Industry After some reflection, Kim realized that Starbucks faced intense direct competition. Kim could think of a wide array of convenient retail locations where a person can purchase a cup of coffee. Kim reasoned that Starbucks competes with a broad scope of coffee beverage retailers, including fast-food chains (for example, McDonalds), doughnut chains (for example, Krispy Kreme, Dunkin Donuts, and Tim Hortons), and convenience stores associated with many gas stations, but that these types of outlets offer an experience that is very different from what Starbucks offers. In particular, Kim was aware that McDonald's had started to expand development of its McCaf shops, which sold premium coffee drinks (lattes, cappuccinos, and mochas) in McDonalds restaurants. It appeared to Kim that the McCaf initiative was intended to be a direct competitive challenge to Starbucks business. Kim also identified a number of companies that were growing chains of retail coffee shops that could be compared to Starbucks, including firms such as Panera Bread Company; Diedrich Coffee; New World Restaurant Group, Inc.; and Caribou Coffee Company, Inc. (a privately held firm). However, these firms were much smaller than Starbucks, with the largest among them being the Panera Bread Company, with approximately 1,700 bakery-cafs system-wide at the end of 2012. On the other end of the spectrum, Kim was aware that Starbucks faced competition from local independent coffee shops and cafs. Kim recognized that despite facing extensive competition, Starbucks had some distinct competitive advantages. Very few companies were implementing a business strategy comparable to that of Starbucks, with emphasis on the quality of the experience, the products, and the service. In addition, only the fast-food chains and the doughnut chains operated on the same scale as Starbucks. Finally, Starbucks had developed a global brand that was synonymous with the quality of the Starbucks experience. Recently, Interbrand ranked the Starbucks brand as one of the worlds top 100 most valuable brand names, estimating it to be worth in excess of 4 billion. The Valuation Controversy In beginning to research Starbucks share price (ticker: SBUX), Kim realized that it had experienced a wild ride over the past five years, following a very similar pattern to Starbucks earnings performance during that time. Starbucks had been one of the hottest companies in the capital market, in large part due to its impressive growth in sales and earnings, up until December of 2006. SBUXs share price had appreciated dramatically, generating cumulative returns that far exceeded those of the SP 500 over that period. The market for Starbucks shares cooled beginning in early 2007, with share prices falling from a high of nearly 40 to a low of under 8 in November of 2008. Since that low point, Starbucks share price began a dramatic recovery. Over the calendar year 2012, SBUX stock price ranged between 42 and 62 per share, and was currently trading at 50 per share, implying a PE ratio of over 28 (based on trailing 12 months earnings per share of 1.79), an earnings multiple that is well above the industry average. Kim further discovered that the capital markets and analysts have mixed opinions on the SBUX stock value. Kim found one-year-ahead price targets from 24 analysts, ranging from a low of 49 to a high of 65, with a mean (median) price target of 59 (60). She found that 30 analysts issued investment recommendations for SBUX: eleven recommend strong buy, ten recommend buy, nine recommend hold, and no analysts recommend sell. The consensus analysts earnings per share forecasts are 2.15 for fiscal 2013 and 2.62 for fiscal 2014. Financial Statements Exhibit 126 presents comparative balance sheets. Exhibit 1.27 presents comparative income statements, and Exhibit 1.28 (pages 7677) presents comparative statements of cash flows for Starbucks for the four fiscal years ending September 30, 2012. Accumulated other comprehensive income includes unrealized gains and losses from marketable securities and investments in securities as well as unrealized gains and losses from translating the financial statements of foreign subsidiaries into U.S. dollars. Why are these gains and losses not included in net income on the income statement? When, if ever, will these gains and losses appear in net income?arrow_forwardStarbucks The first case at the end of this chapter and numerous subsequent chapters is a series of integrative cases involving Starbucks. The series of cases applies the concepts and analytical tools discussed in each chapter to Starbucks financial statements and notes. The preparation of responses to the questions in these cases results in an integrated illustration of the six sequential steps in financial statement analysis discussed in this chapter and throughout the book. Introduction They dont just sell coffee; they sell the Starbucks Experience, remarked Deb Mills while sitting down to enjoy a cup of Starbucks cappuccino with her friend Kim Shannon. Kim, an investment fund manager for a large insurance firm, reflected on that observation and what it might mean for Starbucks as a potential investment opportunity. Glancing around the store, Kim saw a number of people sitting alone or in groups, lingering over their drinks while chatting, reading, or checking e-mail and surfing the Internet through the stores wi-fi network. Kim noted that in addition to the wide selection of hot coffees, French and Italian style espressos, teas, and cold coffee-blended drinks, Starbucks also offered food items and baked goods, packages of roasted coffee beans, coffee-related accessories and equipment, and even its own line of CDs. Intrigued, Kim made a mental note to do a full financial statement and valuation analysis of Starbucks to evaluate whether its business model and common equity shares were as good as their coffee. Growth Strategy Kims research quickly confirmed her friends observation that Starbucks is about the experience of enjoying a good cup of coffee. The Starbucks 2012 Form 10-K (page 3) asserts the following: Our retail objective is to be the leading retailer and brand of coffee in each of our target markets by selling the finest quality coffee and related products, and by providing each customer a unique Starbucks Experience. The Starbucks Experience is built upon superior customer service as well as clean and well-maintained company operated stores that reflect the personalities of the communities in which they operate, thereby building a high degree of customer loyalty. The Starbucks experience strives to create a third placesomewhere besides home and work where a customer can feel comfortable and welcomethrough friendly and skilled customer service in clean and personable retail store environments. This approach enabled Starbucks to grow rapidly from just a single store near Pikes Place Market in Seattle to a global company with 18,066 locations worldwide at the end of fiscal 2012. Of that total, Starbucks owned and operated 9,405 stores (7,857 stores in the Americas; 882 stores in the Europe, Middle East Africa (EMEA) region; and 666 stores in the China and Asia Pacific (CAP) region). In addition, licensees owned and operated a total of 8,661 stores (5,046 stores in the Americas; 987 stores in the EMEA region; and 2,628 stores in the CAP region). Most of Starbucks stores at the end of fiscal 2012 were located in the United States, amounting to one Starbucks retail location for every 28,000 U.S. residents. However, Starbucks was clearly not a company content to focus simply on the U.S. market, as it was extending the reach of its stores globally, with thousands of stores outside the United States. At the end of fiscal 2012, Starbucks owned and operated stores in a number of countries around the world, including 878 stores in Canada, 593 stores in the United Kingdom, and 408 stores in China. Starbucks success can be attributed in part to its successful development and expansion of a European ideaenjoying a fine coffee-based beverage and sharing that experience with others in a comfortable, friendly environment with pleasant, competent service. Starbucks imported the idea of the French and Italian caf into the busy North American lifestyle. Ironically, Starbucks successfully extended its brand and style of a caf into the European continent. On January 16, 2004, Starbucks opened its first coffeehouse in Francein the heart of Paris at 26 Avenue de IOperaand had a total of 67 stores in France by the end of 2012. The success of Starbucks retail coffeehouse concept is illustrated by the fact that by the end of 2012, Star-bucks had opened over 1,100 company-operated and licensed locations in Europe, with the majority of them in the United Kingdom. Not long ago, Starbucks CEO Howard Schultz stated that his vision and ultimate goal for Starbucks was to have 20,000 Starbucks retail locations in the United States, to have another 20,000 retail locations in international markets worldwide, and to have Starbucks recognized among the worlds leading brands. Kim Shannon wondered whether Starbucks could ultimately achieve that level of global penetration because she could name only a few such worldwide companies. Among those that came to mind were McDonalds, with more than 34,000 retail locations in 118 countries; Subway, with more than 34,000 locations in 90 countries; and Yum! Brands, with more than 40,000 restaurants in 130 countries under brand names such as KFC, Pizza Hut, and Taco Bell. Growth in the number of retail stores had been one of the primary drivers of Starbucks growth in revenues. The most significant area of expansion of the Starbucks model in recent years has been the rapid growth in the number of licensed retail stores. At the end of fiscal 1999, Starbucks had only 363 licensed stores, but by the end of fiscal 2012, the number of licensed stores had mushroomed to 8,661. Recent Performance Performance in recent years caused Kim to question whether Starbucks had already reached (or perhaps exceeded) its full potential. She wondered whether it could generate the impressive growth in new stores and revenues that it had created in the past. In fiscal year 2008, Starbucks opened 1,669 net new retail locations (698 net new company-owned stores and 971 new licensed stores), but this number was well below the initial target of 2,500 new stores and well below the 2,571 new stores opened in 2007. Late in 2008, Starbucks announced a plan to close approximately 600 underperforming stores in the United States as well as 64 underperforming stores in Australia. The store closings triggered restructuring charges that reduced Starbucks operating income by 266.9 million in 2008. During fiscal 2009, they increased the restructuring plan to close a total of approximately 800 U.S. stores (an increase of 200), and managed to close 566 U.S. stores during the year. They also announced a plan to close 100 stores in various international markets. The 2009 store closings triggered additional restructuring charges that reduced Starbucks operating income by 332.4 million in 2009. In 2009, for the first time in company history, Starbucks net store growth was negative, with a net of 474 stores closed in the United States (92 stores opened net of 566 closed) and only 89 net new international stores opened (130 stores opened net of 41 closed), for a net total closure of 385 company operated stores. In fiscal 2009, total revenues fell to 9,775 billion from 10,383 billion in fiscal 2008. Fiscal 2009 marked the first year of revenue decline (5.9%) in company history. Prior to 2009, Star-bucks had generated impressive revenue growth rates of 10.3% in fiscal 2008; 20.9% growth in fiscal 2007; and 22.2% in fiscal 2006. Starbucks revenue growth is not just driven by opening new stores; it is also driven by sales growth among existing stores. Through 2007, Starbucks could boast of a streak of 16 consecutive years in which it achieved comparable store sales growth rates equal to or greater than 5%, but that string was broken with negative 3% comparable store sales growth in 2008. Unfortunately, things got worse in 2009, because Starbucks company-operated stores generated a negative 6% growth in comparable U.S. store sales, a negative 2% growth in comparable international store sales, and a negative 6% growth in comparable store sales overall. In response to the downturn in Starbucks business, in January, 2009, Howard Schultz returned from retirement and reassumed his role as president and CEO of Starbucks in order to restructure the business and its potential for growth. Focal points of his transformation plan included taking a more disciplined approach to new store openings, reinvigorating the Star-bucks Experience, developing and implementing even better service and quality, while cutting operating and overhead costs. In addition, the transformation plans included introducing more new beverage and food offerings, such as baked goods, breakfast items and chilled and other foods. A key to Starbucks profit growth lies in increasing same store sales growth via new products. Starbucks regularly introduces new specialty coffee-based drinks and coffee flavors, as well as iced coffee-based drinks, such as the very successful line of Frappuccino drinks and Shaken Iced Refreshment drinks. Under Schultzs renewed leadership, comparable store sales growth rebounded impressively, to 7% growth among U.S. stores and 6% among international stores. Starbucks store openings were very conservative in 2010, owing in part to the difficult economic conditions in the primary markets. In the United States, Starbucks only opened a net 3 new stores in 2010opening 60 licensed stores while closing 57 company-owned stores. Internationally, Star-bucks opened 220 new stores in 2010opening 235 licensed stores while closing 15 company-owned stores. Overall revenue growth also rebounded, reaching 10.7 billion (up 9.5% from 2009). Starbucks continued this modest new store growth trajectory into 2011. Among company-owned stores, Starbucks opened 49 but closed 51 in the United States and opened 180 but closed 36 international stores. Starbucks licensees opened 345 new stores internationally and 133 new stores in the United States. Unfortunately, because Borders Bookstores went bankrupt in 2011, it closed the 475 Starbucks stores that it had licensed. This caused a net negative growth of 342 licensee closings in 2011 in the United States. Overall revenue again sustained healthy growth, with total revenues reaching 11.7 billion (up 9.3% from 2010). Kim was even more encouraged with Starbucks growth in fiscal 2012. During that period, Starbucks opened a total of 1,063 new stores. Of those, Starbucks opened 234 company-owned and 270 licensed stores in the Americas. In the EMEA region, Starbucks opened 10 company-owned and 101 licensed stores, as well as 154 company-owned and 294 licensed stores in the CAP region. Overall revenue reached 13.3 billion (up 14% from 2011). Starbucks also continues to expand the scope of its business model through new channel development in order to reach customers where they work, travel, shop, and dine. To further expand the business model, Starbucks terminated its licensing and distribution agreement with Kraft Foods and now manages its own marketing and distribution of Starbucks whole bean and ground coffee to grocery stores and warehouse club stores. By the end of fiscal 2012, Star-bucks whole bean and ground coffees were available throughout the United States in approximately 39,000 grocery and warehouse club stores. Further, Starbucks sells whole bean and ground coffee through institutional foodservice companies that service business, education, office, hotel, restaurant, airline, and other foodservice accounts. For example, in 2012 Starbucks (and their subsidiary, Seattles Best Coffee) were the only superpremium national brand coffees promoted by Sysco Corporation to such foodservice accounts. Finally, Starbucks had formed partnerships to produce and distribute bottled Frappuccino and DoubleShot drinks with PepsiCo and premium ice creams with Unilever. Despite Starbucks past difficulties with store closings, restructuring charges, and negative comparable store sales growth rates, Kim could see some very positive aspects of Starbucks financial performance and condition. She noted that Starbucks had been profitable in 2008 and 2009, despite the difficulties. She also noted that Starbucks generated record high profits in 2010, 2011, and 2012, suggesting the restructuring and turnaround efforts were proving successful. The restructuring plan was seemingly complete and had helped Starbucks to reduce costs. Further, she noted that Starbucks operating cash flows had remained fairly strong throughout this period. With its positive operating cash flows, Starbucks had retired all of the 713 million in commercial paper and short-term borrowings during 2009, initiated the first dividend in company history in 2010, resumed repurchasing common shares in 2010, and had grown the combined balances in cash and short-term investments over 2.0 billion by fiscal year-end 2012. Product Supply Starbucks purchases green coffee beans from coffee-producing regions around the world and custom roasts and blends them to its exacting standards. Although coffee beans trade in commodity markets and experience volatile prices, Starbucks purchases higher-quality coffee beans that sell at a premium to commodity coffees. Starbucks purchases its coffee beans under fixed-price purchase contracts with various suppliers, with purchase prices reset annually. Starbucks also purchases significant amounts of dairy products from suppliers located near its retail stores. Starbucks purchases paper and plastic products from several suppliers, the prices of which vary with changes in the prices of commodity paper and plastic resin. Competition in the Specialty Coffee Industry After some reflection, Kim realized that Starbucks faced intense direct competition. Kim could think of a wide array of convenient retail locations where a person can purchase a cup of coffee. Kim reasoned that Starbucks competes with a broad scope of coffee beverage retailers, including fast-food chains (for example, McDonalds), doughnut chains (for example, Krispy Kreme, Dunkin Donuts, and Tim Hortons), and convenience stores associated with many gas stations, but that these types of outlets offer an experience that is very different from what Starbucks offers. In particular, Kim was aware that McDonald's had started to expand development of its McCaf shops, which sold premium coffee drinks (lattes, cappuccinos, and mochas) in McDonalds restaurants. It appeared to Kim that the McCaf initiative was intended to be a direct competitive challenge to Starbucks business. Kim also identified a number of companies that were growing chains of retail coffee shops that could be compared to Starbucks, including firms such as Panera Bread Company; Diedrich Coffee; New World Restaurant Group, Inc.; and Caribou Coffee Company, Inc. (a privately held firm). However, these firms were much smaller than Starbucks, with the largest among them being the Panera Bread Company, with approximately 1,700 bakery-cafs system-wide at the end of 2012. On the other end of the spectrum, Kim was aware that Starbucks faced competition from local independent coffee shops and cafs. Kim recognized that despite facing extensive competition, Starbucks had some distinct competitive advantages. Very few companies were implementing a business strategy comparable to that of Starbucks, with emphasis on the quality of the experience, the products, and the service. In addition, only the fast-food chains and the doughnut chains operated on the same scale as Starbucks. Finally, Starbucks had developed a global brand that was synonymous with the quality of the Starbucks experience. Recently, Interbrand ranked the Starbucks brand as one of the worlds top 100 most valuable brand names, estimating it to be worth in excess of 4 billion. The Valuation Controversy In beginning to research Starbucks share price (ticker: SBUX), Kim realized that it had experienced a wild ride over the past five years, following a very similar pattern to Starbucks earnings performance during that time. Starbucks had been one of the hottest companies in the capital market, in large part due to its impressive growth in sales and earnings, up until December of 2006. SBUXs share price had appreciated dramatically, generating cumulative returns that far exceeded those of the SP 500 over that period. The market for Starbucks shares cooled beginning in early 2007, with share prices falling from a high of nearly 40 to a low of under 8 in November of 2008. Since that low point, Starbucks share price began a dramatic recovery. Over the calendar year 2012, SBUX stock price ranged between 42 and 62 per share, and was currently trading at 50 per share, implying a PE ratio of over 28 (based on trailing 12 months earnings per share of 1.79), an earnings multiple that is well above the industry average. Kim further discovered that the capital markets and analysts have mixed opinions on the SBUX stock value. Kim found one-year-ahead price targets from 24 analysts, ranging from a low of 49 to a high of 65, with a mean (median) price target of 59 (60). She found that 30 analysts issued investment recommendations for SBUX: eleven recommend strong buy, ten recommend buy, nine recommend hold, and no analysts recommend sell. The consensus analysts earnings per share forecasts are 2.15 for fiscal 2013 and 2.62 for fiscal 2014. Financial Statements Exhibit 126 presents comparative balance sheets. Exhibit 1.27 presents comparative income statements, and Exhibit 1.28 (pages 7677) presents comparative statements of cash flows for Starbucks for the four fiscal years ending September 30, 2012. How would you characterize the strategy of Starbucks? How does Starbucks create value for its customers? What critical risk and success factors must Starbucks manage?arrow_forward
- Starbucks The first case at the end of this chapter and numerous subsequent chapters is a series of integrative cases involving Starbucks. The series of cases applies the concepts and analytical tools discussed in each chapter to Starbucks financial statements and notes. The preparation of responses to the questions in these cases results in an integrated illustration of the six sequential steps in financial statement analysis discussed in this chapter and throughout the book. Introduction They dont just sell coffee; they sell the Starbucks Experience, remarked Deb Mills while sitting down to enjoy a cup of Starbucks cappuccino with her friend Kim Shannon. Kim, an investment fund manager for a large insurance firm, reflected on that observation and what it might mean for Starbucks as a potential investment opportunity. Glancing around the store, Kim saw a number of people sitting alone or in groups, lingering over their drinks while chatting, reading, or checking e-mail and surfing the Internet through the stores wi-fi network. Kim noted that in addition to the wide selection of hot coffees, French and Italian style espressos, teas, and cold coffeeblended drinks, Starbucks also offered food items and baked goods, packages of roasted coffee beans, coffee-related accessories and equipment, and even its own line of CDs. Intrigued, Kim made a mental note to do a full financial statement and valuation analysis of Starbucks to evaluate whether its business model and common equity shares were as good as their coffee. Growth Strategy Kims research quickly confirmed her friends observation that Starbucks is about the experience of enjoying a good cup of coffee. The Starbucks 2012 Form 10-K (page 3) asserts the following: Our retail objective is to be the leading retailer and brand of coffee in each of our target markets by selling the finest quality coffee and related products, and by providing each customer a unique Starbucks Experience. The Starbucks Experience is built upon superior customer service as well as clean and well-maintained company operated stores that reflect the personalities of the communities in which they operate, thereby building a high degree of customer loyalty. The Starbucks experience strives to create a third placesomewhere besides home and work where a customer can feel comfortable and welcomethrough friendly and skilled customer service in clean and personable retail store environments. This approach enabled Starbucks to grow rapidly from just a single store near Pikes Place Market in Seattle to a global company with 18,066 locations worldwide at the end of fiscal 2012. Of that total, Starbucks owned and operated 9,405 stores (7,857 stores in the Americas; 882 stores in the Europe, Middle East Africa (EMEA) region; and 666 stores in the China and Asia Pacific (CAP) region). In addition, licensees owned and operated a total of 8,661 stores (5,046 stores in the Americas; 987 stores in the EMEA region; and 2,628 stores in the CAP region). Most of Starbucks stores at the end of fiscal 2012 were located in the United States, amounting to one Starbucks retail location for every 28,000 U.S. residents. However, Starbucks was clearly not a company content to focus simply on the U.S. market, as it was extending the reach of its stores globally, with thousands of stores outside the United States. At the end of fiscal 2012, Starbucks owned and operated stores in a number of countries around the world, including 878 stores in Canada, 593 stores in the United Kingdom, and 408 stores in China. Starbucks success can be attributed in part to its successful development and expansion of a European ideaenjoying a fine coffee-based beverage and sharing that experience with others in a comfortable, friendly environment with pleasant, competent service. Starbucks imported the idea of the French and Italian caf into the busy North American lifestyle. Ironically, Starbucks successfully extended its brand and style of a caf into the European continent. On January 16, 2004, Starbucks opened its first coffeehouse in Francein the heart of Paris at 26 Avenue de IOperaand had a total of 67 stores in France by the end of 2012. The success of Starbucks retail coffeehouse concept is illustrated by the fact that by the end of 2012, Starbucks had opened over 1,100 company-operated and licensed locations in Europe, with the majority of them in the United Kingdom. Not long ago, Starbucks CEO Howard Schultz stated that his vision and ultimate goal for Starbucks was to have 20,000 Starbucks retail locations in the United States, to have another 20,000 retail locations in international markets worldwide, and to have Starbucks recognized among the worlds leading brands. Kim Shannon wondered whether Starbucks could ultimately achieve that level of global penetration because she could name only a few such worldwide companies. Among those that came to mind were McDonalds, with more than 34,000 retail locations in 118 countries; Subway, with more than 34,000 locations in 90 countries; and Yum! Brands, with more than 40,000 restaurants in 130 countries under brand names such as KFC, Pizza Hut, and Taco Bell. Growth in the number of retail stores had been one of the primary drivers of Starbucks growth in revenues. The most significant area of expansion of the Starbucks model in recent years has been the rapid growth in the number of licensed retail stores. At the end of fiscal 1999, Starbucks had only 363 licensed stores, but by the end of fiscal 2012, the number of licensed stores had mushroomed to 8,661. Recent Performance Performance in recent years caused Kim to question whether Starbucks had already reached (or perhaps exceeded) its full potential. She wondered whether it could generate the impressive growth in new stores and revenues that it had created in the past. In fiscal year 2008, Starbucks opened 1,669 net new retail locations (698 net new company-owned stores and 971 new licensed stores), but this number was well below the initial target of 2,500 new stores and well below the 2,571 new stores opened in 2007. Late in 2008, Starbucks announced a plan to close approximately 600 underperforming stores in the United States as well as 64 underperforming stores in Australia. The store closings triggered restructuring charges that reduced Starbucks operating income by 266.9 million in 2008. During fiscal 2009, they increased the restructuring plan to close a total of approximately 800 U.S. stores (an increase of 200), and managed to close 566 U.S. stores during the year. They also announced a plan to close 100 stores in various international markets. The 2009 store closings triggered additional restructuring charges that reduced Starbucks operating income by 332.4 million in 2009. In 2009, for the first time in company history, Starbucks net store growth was negative, with a net of 474 stores closed in the United States (92 stores opened net of 566 closed) and only 89 net new international stores opened (130 stores opened net of 41 closed), for a net total closure of 385 company operated stores. In fiscal 2009, total revenues fell to 9.775 billion from 10.383 billion in fiscal 2008. Fiscal 2009 marked the first year of revenue decline (5.9%) in company history. Prior to 2009, Starbucks had generated impressive revenue growth rates of 10.3% in fiscal 2008; 20.9% growth in fiscal 2007; and 22.2% in fiscal 2006. Starbucks revenue growth is not just driven by opening new stores; it is also driven by sales growth among existing stores. Through 2007, Starbucks could boast of a streak of 16 consecutive years in which it achieved comparable store sales growth rates equal to or greater than 5%, but that string was broken with negative 3% comparable store sales growth in 2008. Unfortunately, things got worse in 2009, because Starbucks company-operated stores generated a negative 6% growth in comparable U.S. store sales, a negative 2% growth in comparable international store sales, and a negative 6% growth in comparable store sales overall. In response to the downturn in Starbucks business, in January, 2009, Howard Schultz returned from retirement and reassumed his role as president and CEO of Starbucks in order to restructure the business and its potential for growth. Focal points of his transformation plan included taking a more disciplined approach to new store openings, re invigorating the Starbucks Experience, developing and implementing even better service and quality, while cutting operating and overhead costs. In addition, the transformation plans included introducing more new beverage and food offerings, such as baked goods, breakfast items and chilled and other foods. A key to Starbucks profit growth lies in increasing same store sales growth via new products. Starbucks regularly introduces new specialty coffee-based drinks and coffee flavors, as well as iced coffee-based drinks, such as the very successful line of Frappuccino drinks and Shaken Iced Refreshment drinks. Under Schultzs renewed leadership, comparable store sales growth rebounded impressively, to 7% growth among U.S. stores and 6% among international stores. Starbucks store openings were very conservative in 2010, owing in part to the difficult economic conditions in the primary markets. In the United States, Starbucks only opened a net 3 new stores in 2010opening 60 licensed stores while closing 57 company-owned stores. Internationally, Starbucks opened 220 new stores in 2010opening 235 licensed stores while closing 15 company-owned stores. Overall revenue growth also rebounded, reaching 10.7 billion (up 95% from 2009). Starbucks continued this modest new store growth trajectory into 2011. Among company-owned stores, Starbucks opened 49 but closed 51 in the United States and opened 180 but dosed 36 international stores. Starbucks licensees opened 345 new stores internationally and 133 new stores in the United States. Unfortunately, because Borders Bookstores went bankrupt in 2011, it closed the 475 Starbucks stores that it had licensed. This caused a net negative growth of 342 licensee closings in 2011 in the United States. Overall revenue again sustained healthy growth, with total revenues reaching 11.7 billion (up 9.3% from 2010). Kim was even more encouraged with Starbucks growth in fiscal 2012. During that period, Starbucks opened a total of 1,063 new stores. Of those, Starbucks opened 234 company-owned and 270 licensed stores in the Americas. In the EMEA region, Starbucks opened 10 company-owned and 101 licensed stores, as well as 154 company-owned and 294 licensed stores in the CAP region. Overall revenue reached 13.3 billion (up 14% from 2011). Starbucks also continues to expand the scope of its business model through new channel development in order to "reach customers where they work, travel, shop, and dine." To further expand the business model, Starbucks terminated its licensing and distribution agreement with Kraft Foods and now manages its own marketing and distribution of Starbucks whole bean and ground coffee to grocery stores and warehouse club stores. By the end of fiscal 2012, Starbucks whole bean and ground coffees were available throughout the United States in approximately 39,000 grocery and warehouse club stores. Further, Starbucks sells whole bean and ground coffee through institutional foodservice companies that service business, education, office, hotel, restaurant, airline, and other foodservice accounts. For example, in 2012 Starbucks (and their subsidiary, Seattles Best Coffee) were the only superpremium national brand coffees promoted by Sysco Corporation to such foodservice accounts. Finally, Starbucks had formed partnerships to produce and distribute bottled Frappuccino and DoubleShot drinks with PepsiCo and premium ice creams with Unilever. Despite Starbucks past difficulties with store closings, restructuring charges, and negative comparable store sales growth rates, Kim could see some very positive aspects of Starbucks financial performance and condition. She noted that Starbucks had been profitable in 2008 and 2009, despite the difficulties. She also noted that Starbucks generated record high profits in 2010, 2011, and 2012, suggesting the restructuring and turnaround efforts were proving successful. The restructuring plan was seemingly complete and had helped Starbucks to reduce costs. Further, she noted that Starbucks operating cash flows had remained fairly strong throughout this period. With its positive operating cash flows, Starbucks had retired all of the 713 million in commercial paper and short-term borrowings during 2009, initiated the first dividend in company history in 2010, resumed repurchasing common shares in 2010, and had grown the combined balances in cash and short-term investments over 2.0 billion by fiscal year-end 2012 Product Supply Starbucks purchases green coffee beans from coffee-producing regions around the world and custom roasts and blends them to its exacting standards. Although coffee beans trade in commodity markets and experience volatile prices, Starbucks purchases higher-quality coffee beans that sell at a premium to commodity coffees. Starbucks purchases its coffee beans under fixed-price purchase contracts with various suppliers, with purchase prices reset annually. Starbucks also purchases significant amounts of dairy products from suppliers located near its retail stores. Starbucks purchases paper and plastic products from several suppliers, the prices of which vary with changes in the prices of commodity paper and plastic resin. Competition in the Specialty Coffee Industry After some reflection, Kim realized that Starbucks faced intense direct competition. Kim could think of a wide array of convenient retail locations where a person can purchase a cup of coffee. Kim reasoned that Starbucks competes with a broad scope of coffee beverage retailers, including fast-food chains (for example, McDonalds), doughnut chains (for example, Krispy Kreme, Dunkin Donuts, and Tim Hortons), and convenience stores associated with many gas stations, but that these types of outlets offer an experience that is very different from what Starbucks offers. In particular, Kim was aware that McDonalds had started to expand development of its McCaf shops, which sold premium coffee drinks (lattes, cappuccinos, and mochas) in McDonalds restaurants. It appeared to Kim that the McCaf initiative was intended to be a direct competitive challenge to Starbucks business. Kim also identified a number of companies that were growing chains of retail coffee shops that could be compared to Starbucks, including firms such as Panera Bread Company; Die-drich Coffee; New World Restaurant Group, Inc.; and Caribou Coffee Company, Inc. (a privately held firm). However, these firms were much smaller than Starbucks, with the largest among them being the Panera Bread Company, with approximately 1,700 bakery-cafes system-wide at the end of 2012. On the other end of the spectrum, Kim was aware that Starbucks faced competition from local independent coffee shops and cafs. Kim recognized that despite facing extensive competition, Starbucks had some distinct competitive advantages. Very few companies were implementing a business strategy comparable to that of Starbucks, with emphasis on the quality of the experience, the products, and the service. In addition, only the fast-food chains and the doughnut chains operated on the same scale as Starbucks. Finally, Starbucks had developed a global brand that was synonymous with the quality of the Starbucks experience. Recently, Interbrand ranked the Starbucks brand as one of the worlds top 100 most valuable brand names, estimating it to be worth in excess of 4 billion. The Valuation Controversy In beginning to research Starbucks share price (ticker: SBUX), Kim realized that it had experienced a wild ride over the past five years, following a very similar pattern to Starbucks earnings performance during that time. Starbucks had been one of the hottest companies in the capital market, in large part due to Its impressive growth in sales and earnings, up until December of 2006. SBUXs share price had appreciated dramatically, generating cumulative returns that far exceeded those of the SP 500 over that period. The market for Starbucks shares cooled beginning in early 2007, with share prices falling from a high of nearly 540 to a low of under 58 in November of 2008. Since that low point, Starbucks share price began a dramatic recovery. Over the calendar year 2012, SBUX stock price ranged between 542 and 562 per share, and was currently trading at 550 per share, implying a PE ratio of over 28 (based on trailing 12 months earnings per share of 51.79), an earnings multiple that is well above the industry average. Kim further discovered thatw the capital markets and analysts have mixed opinions on the SBUX stock value Kim found one-year-a head price targets from 24 analysts, ranging from a low of 549 to a high of 565, with a mean (median) price target of 559 (560). She found that 30 analysts issued investment recommendations for SBUX: eleven recommend strong buy, ten recommend buy, nine recommend hold, and no analysts recommend sell. The consensus analysts earnings per share forecasts are 52.15 for fiscal 2013 and 52.62 for fiscal 2014. Financial Statements Exhibit 1.26 presents comparative balance sheets, Exhibit 1.27 presents comparative income statements, and Exhibit 128 (pages 76-77) presents comparative statements of cash flows for Starbucks for the four fiscal years ending September 30, 2012. How has the revenue mix of Starbucks changed from 2009 to 2012? Relate these changes to Starbucks business strategy.arrow_forwardStarbucks The first case at the end of this chapter and numerous subsequent chapters is a series of integrative cases involving Starbucks. The series of cases applies the concepts and analytical tools discussed in each chapter to Starbucks financial statements and notes. The preparation of responses to the questions in these cases results in an integrated illustration of the six sequential steps in financial statement analysis discussed in this chapter and throughout the book. Introduction They dont just sell coffee; they sell the Starbucks Experience, remarked Deb Mills while sitting down to enjoy a cup of Starbucks cappuccino with her friend Kim Shannon. Kim, an investment fund manager for a large insurance firm, reflected on that observation and what it might mean for Starbucks as a potential investment opportunity. Glancing around the store, Kim saw a number of people sitting alone or in groups, lingering over their drinks while chatting, reading, or checking e-mail and surfing the Internet through the stores wi-fi network. Kim noted that in addition to the wide selection of hot coffees, French and Italian style espressos, teas, and cold coffee-blended drinks, Starbucks also offered food items and baked goods, packages of roasted coffee beans, coffee-related accessories and equipment, and even its own line of CDs. Intrigued, Kim made a mental note to do a full financial statement and valuation analysis of Starbucks to evaluate whether its business model and common equity shares were as good as their coffee. Growth Strategy Kims research quickly confirmed her friends observation that Starbucks is about the experience of enjoying a good cup of coffee. The Starbucks 2012 Form 10-K (page 3) asserts the following: Our retail objective is to be the leading retailer and brand of coffee in each of our target markets by selling the finest quality coffee and related products, and by providing each customer a unique Starbucks Experience. The Starbucks Experience is built upon superior customer service as well as clean and well-maintained company operated stores that reflect the personalities of the communities in which they operate, thereby building a high degree of customer loyalty. The Starbucks experience strives to create a third placesomewhere besides home and work where a customer can feel comfortable and welcomethrough friendly and skilled customer service in clean and personable retail store environments. This approach enabled Starbucks to grow rapidly from just a single store near Pikes Place Market in Seattle to a global company with 18,066 locations worldwide at the end of fiscal 2012. Of that total, Starbucks owned and operated 9,405 stores (7,857 stores in the Americas; 882 stores in the Europe, Middle East Africa (EMEA) region; and 666 stores in the China and Asia Pacific (CAP) region). In addition, licensees owned and operated a total of 8,661 stores (5,046 stores in the Americas; 987 stores in the EMEA region; and 2,628 stores in the CAP region). Most of Starbucks stores at the end of fiscal 2012 were located in the United States, amounting to one Starbucks retail location for every 28,000 U.S. residents. However, Starbucks was clearly not a company content to focus simply on the U.S. market, as it was extending the reach of its stores globally, with thousands of stores outside the United States. At the end of fiscal 2012, Starbucks owned and operated stores in a number of countries around the world, including 878 stores in Canada, 593 stores in the United Kingdom, and 408 stores in China. Starbucks success can be attributed in part to its successful development and expansion of a European ideaenjoying a fine coffee-based beverage and sharing that experience with others in a comfortable, friendly environment with pleasant, competent service. Starbucks imported the idea of the French and Italian caf into the busy North American lifestyle. Ironically, Starbucks successfully extended its brand and style of a caf into the European continent. On January 16, 2004, Starbucks opened its first coffeehouse in Francein the heart of Paris at 26 Avenue de IOperaand had a total of 67 stores in France by the end of 2012. The success of Starbucks retail coffeehouse concept is illustrated by the fact that by the end of 2012, Star-bucks had opened over 1,100 company-operated and licensed locations in Europe, with the majority of them in the United Kingdom. Not long ago, Starbucks CEO Howard Schultz stated that his vision and ultimate goal for Starbucks was to have 20,000 Starbucks retail locations in the United States, to have another 20,000 retail locations in international markets worldwide, and to have Starbucks recognized among the worlds leading brands. Kim Shannon wondered whether Starbucks could ultimately achieve that level of global penetration because she could name only a few such worldwide companies. Among those that came to mind were McDonalds, with more than 34,000 retail locations in 118 countries; Subway, with more than 34,000 locations in 90 countries; and Yum! Brands, with more than 40,000 restaurants in 130 countries under brand names such as KFC, Pizza Hut, and Taco Bell. Growth in the number of retail stores had been one of the primary drivers of Starbucks growth in revenues. The most significant area of expansion of the Starbucks model in recent years has been the rapid growth in the number of licensed retail stores. At the end of fiscal 1999, Starbucks had only 363 licensed stores, but by the end of fiscal 2012, the number of licensed stores had mushroomed to 8,661. Recent Performance Performance in recent years caused Kim to question whether Starbucks had already reached (or perhaps exceeded) its full potential. She wondered whether it could generate the impressive growth in new stores and revenues that it had created in the past. In fiscal year 2008, Starbucks opened 1,669 net new retail locations (698 net new company-owned stores and 971 new licensed stores), but this number was well below the initial target of 2,500 new stores and well below the 2,571 new stores opened in 2007. Late in 2008, Starbucks announced a plan to close approximately 600 underperforming stores in the United States as well as 64 underperforming stores in Australia. The store closings triggered restructuring charges that reduced Starbucks operating income by 266.9 million in 2008. During fiscal 2009, they increased the restructuring plan to close a total of approximately 800 U.S. stores (an increase of 200), and managed to close 566 U.S. stores during the year. They also announced a plan to close 100 stores in various international markets. The 2009 store closings triggered additional restructuring charges that reduced Starbucks operating income by 332.4 million in 2009. In 2009, for the first time in company history, Starbucks net store growth was negative, with a net of 474 stores closed in the United States (92 stores opened net of 566 closed) and only 89 net new international stores opened (130 stores opened net of 41 closed), for a net total closure of 385 company operated stores. In fiscal 2009, total revenues fell to 9,775 billion from 10,383 billion in fiscal 2008. Fiscal 2009 marked the first year of revenue decline (5.9%) in company history. Prior to 2009, Star-bucks had generated impressive revenue growth rates of 10.3% in fiscal 2008; 20.9% growth in fiscal 2007; and 22.2% in fiscal 2006. Starbucks revenue growth is not just driven by opening new stores; it is also driven by sales growth among existing stores. Through 2007, Starbucks could boast of a streak of 16 consecutive years in which it achieved comparable store sales growth rates equal to or greater than 5%, but that string was broken with negative 3% comparable store sales growth in 2008. Unfortunately, things got worse in 2009, because Starbucks company-operated stores generated a negative 6% growth in comparable U.S. store sales, a negative 2% growth in comparable international store sales, and a negative 6% growth in comparable store sales overall. In response to the downturn in Starbucks business, in January, 2009, Howard Schultz returned from retirement and reassumed his role as president and CEO of Starbucks in order to restructure the business and its potential for growth. Focal points of his transformation plan included taking a more disciplined approach to new store openings, reinvigorating the Star-bucks Experience, developing and implementing even better service and quality, while cutting operating and overhead costs. In addition, the transformation plans included introducing more new beverage and food offerings, such as baked goods, breakfast items and chilled and other foods. A key to Starbucks profit growth lies in increasing same store sales growth via new products. Starbucks regularly introduces new specialty coffee-based drinks and coffee flavors, as well as iced coffee-based drinks, such as the very successful line of Frappuccino drinks and Shaken Iced Refreshment drinks. Under Schultzs renewed leadership, comparable store sales growth rebounded impressively, to 7% growth among U.S. stores and 6% among international stores. Starbucks store openings were very conservative in 2010, owing in part to the difficult economic conditions in the primary markets. In the United States, Starbucks only opened a net 3 new stores in 2010opening 60 licensed stores while closing 57 company-owned stores. Internationally, Star-bucks opened 220 new stores in 2010opening 235 licensed stores while closing 15 company-owned stores. Overall revenue growth also rebounded, reaching 10.7 billion (up 9.5% from 2009). Starbucks continued this modest new store growth trajectory into 2011. Among company-owned stores, Starbucks opened 49 but closed 51 in the United States and opened 180 but closed 36 international stores. Starbucks licensees opened 345 new stores internationally and 133 new stores in the United States. Unfortunately, because Borders Bookstores went bankrupt in 2011, it closed the 475 Starbucks stores that it had licensed. This caused a net negative growth of 342 licensee closings in 2011 in the United States. Overall revenue again sustained healthy growth, with total revenues reaching 11.7 billion (up 9.3% from 2010). Kim was even more encouraged with Starbucks growth in fiscal 2012. During that period, Starbucks opened a total of 1,063 new stores. Of those, Starbucks opened 234 company-owned and 270 licensed stores in the Americas. In the EMEA region, Starbucks opened 10 company-owned and 101 licensed stores, as well as 154 company-owned and 294 licensed stores in the CAP region. Overall revenue reached 13.3 billion (up 14% from 2011). Starbucks also continues to expand the scope of its business model through new channel development in order to reach customers where they work, travel, shop, and dine. To further expand the business model, Starbucks terminated its licensing and distribution agreement with Kraft Foods and now manages its own marketing and distribution of Starbucks whole bean and ground coffee to grocery stores and warehouse club stores. By the end of fiscal 2012, Star-bucks whole bean and ground coffees were available throughout the United States in approximately 39,000 grocery and warehouse club stores. Further, Starbucks sells whole bean and ground coffee through institutional foodservice companies that service business, education, office, hotel, restaurant, airline, and other foodservice accounts. For example, in 2012 Starbucks (and their subsidiary, Seattles Best Coffee) were the only superpremium national brand coffees promoted by Sysco Corporation to such foodservice accounts. Finally, Starbucks had formed partnerships to produce and distribute bottled Frappuccino and DoubleShot drinks with PepsiCo and premium ice creams with Unilever. Despite Starbucks past difficulties with store closings, restructuring charges, and negative comparable store sales growth rates, Kim could see some very positive aspects of Starbucks financial performance and condition. She noted that Starbucks had been profitable in 2008 and 2009, despite the difficulties. She also noted that Starbucks generated record high profits in 2010, 2011, and 2012, suggesting the restructuring and turnaround efforts were proving successful. The restructuring plan was seemingly complete and had helped Starbucks to reduce costs. Further, she noted that Starbucks operating cash flows had remained fairly strong throughout this period. With its positive operating cash flows, Starbucks had retired all of the 713 million in commercial paper and short-term borrowings during 2009, initiated the first dividend in company history in 2010, resumed repurchasing common shares in 2010, and had grown the combined balances in cash and short-term investments over 2.0 billion by fiscal year-end 2012. Product Supply Starbucks purchases green coffee beans from coffee-producing regions around the world and custom roasts and blends them to its exacting standards. Although coffee beans trade in commodity markets and experience volatile prices, Starbucks purchases higher-quality coffee beans that sell at a premium to commodity coffees. Starbucks purchases its coffee beans under fixed-price purchase contracts with various suppliers, with purchase prices reset annually. Starbucks also purchases significant amounts of dairy products from suppliers located near its retail stores. Starbucks purchases paper and plastic products from several suppliers, the prices of which vary with changes in the prices of commodity paper and plastic resin. Competition in the Specialty Coffee Industry After some reflection, Kim realized that Starbucks faced intense direct competition. Kim could think of a wide array of convenient retail locations where a person can purchase a cup of coffee. Kim reasoned that Starbucks competes with a broad scope of coffee beverage retailers, including fast-food chains (for example, McDonalds), doughnut chains (for example, Krispy Kreme, Dunkin Donuts, and Tim Hortons), and convenience stores associated with many gas stations, but that these types of outlets offer an experience that is very different from what Starbucks offers. In particular, Kim was aware that McDonald's had started to expand development of its McCaf shops, which sold premium coffee drinks (lattes, cappuccinos, and mochas) in McDonalds restaurants. It appeared to Kim that the McCaf initiative was intended to be a direct competitive challenge to Starbucks business. Kim also identified a number of companies that were growing chains of retail coffee shops that could be compared to Starbucks, including firms such as Panera Bread Company; Diedrich Coffee; New World Restaurant Group, Inc.; and Caribou Coffee Company, Inc. (a privately held firm). However, these firms were much smaller than Starbucks, with the largest among them being the Panera Bread Company, with approximately 1,700 bakery-cafs system-wide at the end of 2012. On the other end of the spectrum, Kim was aware that Starbucks faced competition from local independent coffee shops and cafs. Kim recognized that despite facing extensive competition, Starbucks had some distinct competitive advantages. Very few companies were implementing a business strategy comparable to that of Starbucks, with emphasis on the quality of the experience, the products, and the service. In addition, only the fast-food chains and the doughnut chains operated on the same scale as Starbucks. Finally, Starbucks had developed a global brand that was synonymous with the quality of the Starbucks experience. Recently, Interbrand ranked the Starbucks brand as one of the worlds top 100 most valuable brand names, estimating it to be worth in excess of 4 billion. The Valuation Controversy In beginning to research Starbucks share price (ticker: SBUX), Kim realized that it had experienced a wild ride over the past five years, following a very similar pattern to Starbucks earnings performance during that time. Starbucks had been one of the hottest companies in the capital market, in large part due to its impressive growth in sales and earnings, up until December of 2006. SBUXs share price had appreciated dramatically, generating cumulative returns that far exceeded those of the SP 500 over that period. The market for Starbucks shares cooled beginning in early 2007, with share prices falling from a high of nearly 40 to a low of under 8 in November of 2008. Since that low point, Starbucks share price began a dramatic recovery. Over the calendar year 2012, SBUX stock price ranged between 42 and 62 per share, and was currently trading at 50 per share, implying a PE ratio of over 28 (based on trailing 12 months earnings per share of 1.79), an earnings multiple that is well above the industry average. Kim further discovered that the capital markets and analysts have mixed opinions on the SBUX stock value. Kim found one-year-ahead price targets from 24 analysts, ranging from a low of 49 to a high of 65, with a mean (median) price target of 59 (60). She found that 30 analysts issued investment recommendations for SBUX: eleven recommend strong buy, ten recommend buy, nine recommend hold, and no analysts recommend sell. The consensus analysts earnings per share forecasts are 2.15 for fiscal 2013 and 2.62 for fiscal 2014. Financial Statements Exhibit 126 presents comparative balance sheets. Exhibit 1.27 presents comparative income statements, and Exhibit 1.28 (pages 7677) presents comparative statements of cash flows for Starbucks for the four fiscal years ending September 30, 2012. Starbucks reports income from equity investees on its income statement. Using the narrative information provided in this case, describe the nature of this type of income.arrow_forwardStarbucks The first case at the end of this chapter and numerous subsequent chapters is a series of integrative cases involving Starbucks. The series of cases applies the concepts and analytical tools discussed in each chapter to Starbucks financial statements and notes. The preparation of responses to the questions in these cases results in an integrated illustration of the six sequential steps in financial statement analysis discussed in this chapter and throughout the book. Introduction They dont just sell coffee; they sell the Starbucks Experience, remarked Deb Mills while sitting down to enjoy a cup of Starbucks cappuccino with her friend Kim Shannon. Kim, an investment fund manager for a large insurance firm, reflected on that observation and what it might mean for Starbucks as a potential investment opportunity. Glancing around the store, Kim saw a number of people sitting alone or in groups, lingering over their drinks while chatting, reading, or checking e-mail and surfing the Internet through the stores wi-fi network. Kim noted that in addition to the wide selection of hot coffees, French and Italian style espressos, teas, and cold coffee-blended drinks, Starbucks also offered food items and baked goods, packages of roasted coffee beans, coffee-related accessories and equipment, and even its own line of CDs. Intrigued, Kim made a mental note to do a full financial statement and valuation analysis of Starbucks to evaluate whether its business model and common equity shares were as good as their coffee. Growth Strategy Kims research quickly confirmed her friends observation that Starbucks is about the experience of enjoying a good cup of coffee. The Starbucks 2012 Form 10-K (page 3) asserts the following: Our retail objective is to be the leading retailer and brand of coffee in each of our target markets by selling the finest quality coffee and related products, and by providing each customer a unique Starbucks Experience. The Starbucks Experience is built upon superior customer service as well as clean and well-maintained company operated stores that reflect the personalities of the communities in which they operate, thereby building a high degree of customer loyalty. The Starbucks experience strives to create a third placesomewhere besides home and work where a customer can feel comfortable and welcomethrough friendly and skilled customer service in clean and personable retail store environments. This approach enabled Starbucks to grow rapidly from just a single store near Pikes Place Market in Seattle to a global company with 18,066 locations worldwide at the end of fiscal 2012. Of that total, Starbucks owned and operated 9,405 stores (7,857 stores in the Americas; 882 stores in the Europe, Middle East Africa (EMEA) region; and 666 stores in the China and Asia Pacific (CAP) region). In addition, licensees owned and operated a total of 8,661 stores (5,046 stores in the Americas; 987 stores in the EMEA region; and 2,628 stores in the CAP region). Most of Starbucks stores at the end of fiscal 2012 were located in the United States, amounting to one Starbucks retail location for every 28,000 U.S. residents. However, Starbucks was clearly not a company content to focus simply on the U.S. market, as it was extending the reach of its stores globally, with thousands of stores outside the United States. At the end of fiscal 2012, Starbucks owned and operated stores in a number of countries around the world, including 878 stores in Canada, 593 stores in the United Kingdom, and 408 stores in China. Starbucks success can be attributed in part to its successful development and expansion of a European ideaenjoying a fine coffee-based beverage and sharing that experience with others in a comfortable, friendly environment with pleasant, competent service. Starbucks imported the idea of the French and Italian caf into the busy North American lifestyle. Ironically, Starbucks successfully extended its brand and style of a caf into the European continent. On January 16, 2004, Starbucks opened its first coffeehouse in Francein the heart of Paris at 26 Avenue de IOperaand had a total of 67 stores in France by the end of 2012. The success of Starbucks retail coffeehouse concept is illustrated by the fact that by the end of 2012, Star-bucks had opened over 1,100 company-operated and licensed locations in Europe, with the majority of them in the United Kingdom. Not long ago, Starbucks CEO Howard Schultz stated that his vision and ultimate goal for Starbucks was to have 20,000 Starbucks retail locations in the United States, to have another 20,000 retail locations in international markets worldwide, and to have Starbucks recognized among the worlds leading brands. Kim Shannon wondered whether Starbucks could ultimately achieve that level of global penetration because she could name only a few such worldwide companies. Among those that came to mind were McDonalds, with more than 34,000 retail locations in 118 countries; Subway, with more than 34,000 locations in 90 countries; and Yum! Brands, with more than 40,000 restaurants in 130 countries under brand names such as KFC, Pizza Hut, and Taco Bell. Growth in the number of retail stores had been one of the primary drivers of Starbucks growth in revenues. The most significant area of expansion of the Starbucks model in recent years has been the rapid growth in the number of licensed retail stores. At the end of fiscal 1999, Starbucks had only 363 licensed stores, but by the end of fiscal 2012, the number of licensed stores had mushroomed to 8,661. Recent Performance Performance in recent years caused Kim to question whether Starbucks had already reached (or perhaps exceeded) its full potential. She wondered whether it could generate the impressive growth in new stores and revenues that it had created in the past. In fiscal year 2008, Starbucks opened 1,669 net new retail locations (698 net new company-owned stores and 971 new licensed stores), but this number was well below the initial target of 2,500 new stores and well below the 2,571 new stores opened in 2007. Late in 2008, Starbucks announced a plan to close approximately 600 underperforming stores in the United States as well as 64 underperforming stores in Australia. The store closings triggered restructuring charges that reduced Starbucks operating income by 266.9 million in 2008. During fiscal 2009, they increased the restructuring plan to close a total of approximately 800 U.S. stores (an increase of 200), and managed to close 566 U.S. stores during the year. They also announced a plan to close 100 stores in various international markets. The 2009 store closings triggered additional restructuring charges that reduced Starbucks operating income by 332.4 million in 2009. In 2009, for the first time in company history, Starbucks net store growth was negative, with a net of 474 stores closed in the United States (92 stores opened net of 566 closed) and only 89 net new international stores opened (130 stores opened net of 41 closed), for a net total closure of 385 company operated stores. In fiscal 2009, total revenues fell to 9,775 billion from 10,383 billion in fiscal 2008. Fiscal 2009 marked the first year of revenue decline (5.9%) in company history. Prior to 2009, Star-bucks had generated impressive revenue growth rates of 10.3% in fiscal 2008; 20.9% growth in fiscal 2007; and 22.2% in fiscal 2006. Starbucks revenue growth is not just driven by opening new stores; it is also driven by sales growth among existing stores. Through 2007, Starbucks could boast of a streak of 16 consecutive years in which it achieved comparable store sales growth rates equal to or greater than 5%, but that string was broken with negative 3% comparable store sales growth in 2008. Unfortunately, things got worse in 2009, because Starbucks company-operated stores generated a negative 6% growth in comparable U.S. store sales, a negative 2% growth in comparable international store sales, and a negative 6% growth in comparable store sales overall. In response to the downturn in Starbucks business, in January, 2009, Howard Schultz returned from retirement and reassumed his role as president and CEO of Starbucks in order to restructure the business and its potential for growth. Focal points of his transformation plan included taking a more disciplined approach to new store openings, reinvigorating the Star-bucks Experience, developing and implementing even better service and quality, while cutting operating and overhead costs. In addition, the transformation plans included introducing more new beverage and food offerings, such as baked goods, breakfast items and chilled and other foods. A key to Starbucks profit growth lies in increasing same store sales growth via new products. Starbucks regularly introduces new specialty coffee-based drinks and coffee flavors, as well as iced coffee-based drinks, such as the very successful line of Frappuccino drinks and Shaken Iced Refreshment drinks. Under Schultzs renewed leadership, comparable store sales growth rebounded impressively, to 7% growth among U.S. stores and 6% among international stores. Starbucks store openings were very conservative in 2010, owing in part to the difficult economic conditions in the primary markets. In the United States, Starbucks only opened a net 3 new stores in 2010opening 60 licensed stores while closing 57 company-owned stores. Internationally, Star-bucks opened 220 new stores in 2010opening 235 licensed stores while closing 15 company-owned stores. Overall revenue growth also rebounded, reaching 10.7 billion (up 9.5% from 2009). Starbucks continued this modest new store growth trajectory into 2011. Among company-owned stores, Starbucks opened 49 but closed 51 in the United States and opened 180 but closed 36 international stores. Starbucks licensees opened 345 new stores internationally and 133 new stores in the United States. Unfortunately, because Borders Bookstores went bankrupt in 2011, it closed the 475 Starbucks stores that it had licensed. This caused a net negative growth of 342 licensee closings in 2011 in the United States. Overall revenue again sustained healthy growth, with total revenues reaching 11.7 billion (up 9.3% from 2010). Kim was even more encouraged with Starbucks growth in fiscal 2012. During that period, Starbucks opened a total of 1,063 new stores. Of those, Starbucks opened 234 company-owned and 270 licensed stores in the Americas. In the EMEA region, Starbucks opened 10 company-owned and 101 licensed stores, as well as 154 company-owned and 294 licensed stores in the CAP region. Overall revenue reached 13.3 billion (up 14% from 2011). Starbucks also continues to expand the scope of its business model through new channel development in order to reach customers where they work, travel, shop, and dine. To further expand the business model, Starbucks terminated its licensing and distribution agreement with Kraft Foods and now manages its own marketing and distribution of Starbucks whole bean and ground coffee to grocery stores and warehouse club stores. By the end of fiscal 2012, Star-bucks whole bean and ground coffees were available throughout the United States in approximately 39,000 grocery and warehouse club stores. Further, Starbucks sells whole bean and ground coffee through institutional foodservice companies that service business, education, office, hotel, restaurant, airline, and other foodservice accounts. For example, in 2012 Starbucks (and their subsidiary, Seattles Best Coffee) were the only superpremium national brand coffees promoted by Sysco Corporation to such foodservice accounts. Finally, Starbucks had formed partnerships to produce and distribute bottled Frappuccino and DoubleShot drinks with PepsiCo and premium ice creams with Unilever. Despite Starbucks past difficulties with store closings, restructuring charges, and negative comparable store sales growth rates, Kim could see some very positive aspects of Starbucks financial performance and condition. She noted that Starbucks had been profitable in 2008 and 2009, despite the difficulties. She also noted that Starbucks generated record high profits in 2010, 2011, and 2012, suggesting the restructuring and turnaround efforts were proving successful. The restructuring plan was seemingly complete and had helped Starbucks to reduce costs. Further, she noted that Starbucks operating cash flows had remained fairly strong throughout this period. With its positive operating cash flows, Starbucks had retired all of the 713 million in commercial paper and short-term borrowings during 2009, initiated the first dividend in company history in 2010, resumed repurchasing common shares in 2010, and had grown the combined balances in cash and short-term investments over 2.0 billion by fiscal year-end 2012. Product Supply Starbucks purchases green coffee beans from coffee-producing regions around the world and custom roasts and blends them to its exacting standards. Although coffee beans trade in commodity markets and experience volatile prices, Starbucks purchases higher-quality coffee beans that sell at a premium to commodity coffees. Starbucks purchases its coffee beans under fixed-price purchase contracts with various suppliers, with purchase prices reset annually. Starbucks also purchases significant amounts of dairy products from suppliers located near its retail stores. Starbucks purchases paper and plastic products from several suppliers, the prices of which vary with changes in the prices of commodity paper and plastic resin. Competition in the Specialty Coffee Industry After some reflection, Kim realized that Starbucks faced intense direct competition. Kim could think of a wide array of convenient retail locations where a person can purchase a cup of coffee. Kim reasoned that Starbucks competes with a broad scope of coffee beverage retailers, including fast-food chains (for example, McDonalds), doughnut chains (for example, Krispy Kreme, Dunkin Donuts, and Tim Hortons), and convenience stores associated with many gas stations, but that these types of outlets offer an experience that is very different from what Starbucks offers. In particular, Kim was aware that McDonald's had started to expand development of its McCaf shops, which sold premium coffee drinks (lattes, cappuccinos, and mochas) in McDonalds restaurants. It appeared to Kim that the McCaf initiative was intended to be a direct competitive challenge to Starbucks business. Kim also identified a number of companies that were growing chains of retail coffee shops that could be compared to Starbucks, including firms such as Panera Bread Company; Diedrich Coffee; New World Restaurant Group, Inc.; and Caribou Coffee Company, Inc. (a privately held firm). However, these firms were much smaller than Starbucks, with the largest among them being the Panera Bread Company, with approximately 1,700 bakery-cafs system-wide at the end of 2012. On the other end of the spectrum, Kim was aware that Starbucks faced competition from local independent coffee shops and cafs. Kim recognized that despite facing extensive competition, Starbucks had some distinct competitive advantages. Very few companies were implementing a business strategy comparable to that of Starbucks, with emphasis on the quality of the experience, the products, and the service. In addition, only the fast-food chains and the doughnut chains operated on the same scale as Starbucks. Finally, Starbucks had developed a global brand that was synonymous with the quality of the Starbucks experience. Recently, Interbrand ranked the Starbucks brand as one of the worlds top 100 most valuable brand names, estimating it to be worth in excess of 4 billion. The Valuation Controversy In beginning to research Starbucks share price (ticker: SBUX), Kim realized that it had experienced a wild ride over the past five years, following a very similar pattern to Starbucks earnings performance during that time. Starbucks had been one of the hottest companies in the capital market, in large part due to its impressive growth in sales and earnings, up until December of 2006. SBUXs share price had appreciated dramatically, generating cumulative returns that far exceeded those of the SP 500 over that period. The market for Starbucks shares cooled beginning in early 2007, with share prices falling from a high of nearly 40 to a low of under 8 in November of 2008. Since that low point, Starbucks share price began a dramatic recovery. Over the calendar year 2012, SBUX stock price ranged between 42 and 62 per share, and was currently trading at 50 per share, implying a PE ratio of over 28 (based on trailing 12 months earnings per share of 1.79), an earnings multiple that is well above the industry average. Kim further discovered that the capital markets and analysts have mixed opinions on the SBUX stock value. Kim found one-year-ahead price targets from 24 analysts, ranging from a low of 49 to a high of 65, with a mean (median) price target of 59 (60). She found that 30 analysts issued investment recommendations for SBUX: eleven recommend strong buy, ten recommend buy, nine recommend hold, and no analysts recommend sell. The consensus analysts earnings per share forecasts are 2.15 for fiscal 2013 and 2.62 for fiscal 2014. Financial Statements Exhibit 126 presents comparative balance sheets. Exhibit 1.27 presents comparative income statements, and Exhibit 1.28 (pages 7677) presents comparative statements of cash flows for Starbucks for the four fiscal years ending September 30, 2012. Deferred income taxes appear as a current asset on the balance sheet. Under what circumstances will deferred income taxes give rise to an asset?arrow_forward
- Starbucks The first case at the end of this chapter and numerous subsequent chapters is a series of integrative cases involving Starbucks. The series of cases applies the concepts and analytical tools discussed in each chapter to Starbucks financial statements and notes. The preparation of responses to the questions in these cases results in an integrated illustration of the six sequential steps in financial statement analysis discussed in this chapter and throughout the book. Introduction They dont just sell coffee; they sell the Starbucks Experience, remarked Deb Mills while sitting down to enjoy a cup of Starbucks cappuccino with her friend Kim Shannon. Kim, an investment fund manager for a large insurance firm, reflected on that observation and what it might mean for Starbucks as a potential investment opportunity. Glancing around the store, Kim saw a number of people sitting alone or in groups, lingering over their drinks while chatting, reading, or checking e-mail and surfing the Internet through the stores wi-fi network. Kim noted that in addition to the wide selection of hot coffees, French and Italian style espressos, teas, and cold coffee-blended drinks, Starbucks also offered food items and baked goods, packages of roasted coffee beans, coffee-related accessories and equipment, and even its own line of CDs. Intrigued, Kim made a mental note to do a full financial statement and valuation analysis of Starbucks to evaluate whether its business model and common equity shares were as good as their coffee. Growth Strategy Kims research quickly confirmed her friends observation that Starbucks is about the experience of enjoying a good cup of coffee. The Starbucks 2012 Form 10-K (page 3) asserts the following: Our retail objective is to be the leading retailer and brand of coffee in each of our target markets by selling the finest quality coffee and related products, and by providing each customer a unique Starbucks Experience. The Starbucks Experience is built upon superior customer service as well as clean and well-maintained company operated stores that reflect the personalities of the communities in which they operate, thereby building a high degree of customer loyalty. The Starbucks experience strives to create a third placesomewhere besides home and work where a customer can feel comfortable and welcomethrough friendly and skilled customer service in clean and personable retail store environments. This approach enabled Starbucks to grow rapidly from just a single store near Pikes Place Market in Seattle to a global company with 18,066 locations worldwide at the end of fiscal 2012. Of that total, Starbucks owned and operated 9,405 stores (7,857 stores in the Americas; 882 stores in the Europe, Middle East Africa (EMEA) region; and 666 stores in the China and Asia Pacific (CAP) region). In addition, licensees owned and operated a total of 8,661 stores (5,046 stores in the Americas; 987 stores in the EMEA region; and 2,628 stores in the CAP region). Most of Starbucks stores at the end of fiscal 2012 were located in the United States, amounting to one Starbucks retail location for every 28,000 U.S. residents. However, Starbucks was clearly not a company content to focus simply on the U.S. market, as it was extending the reach of its stores globally, with thousands of stores outside the United States. At the end of fiscal 2012, Starbucks owned and operated stores in a number of countries around the world, including 878 stores in Canada, 593 stores in the United Kingdom, and 408 stores in China. Starbucks success can be attributed in part to its successful development and expansion of a European ideaenjoying a fine coffee-based beverage and sharing that experience with others in a comfortable, friendly environment with pleasant, competent service. Starbucks imported the idea of the French and Italian caf into the busy North American lifestyle. Ironically, Starbucks successfully extended its brand and style of a caf into the European continent. On January 16, 2004, Starbucks opened its first coffeehouse in Francein the heart of Paris at 26 Avenue de IOperaand had a total of 67 stores in France by the end of 2012. The success of Starbucks retail coffeehouse concept is illustrated by the fact that by the end of 2012, Star-bucks had opened over 1,100 company-operated and licensed locations in Europe, with the majority of them in the United Kingdom. Not long ago, Starbucks CEO Howard Schultz stated that his vision and ultimate goal for Starbucks was to have 20,000 Starbucks retail locations in the United States, to have another 20,000 retail locations in international markets worldwide, and to have Starbucks recognized among the worlds leading brands. Kim Shannon wondered whether Starbucks could ultimately achieve that level of global penetration because she could name only a few such worldwide companies. Among those that came to mind were McDonalds, with more than 34,000 retail locations in 118 countries; Subway, with more than 34,000 locations in 90 countries; and Yum! Brands, with more than 40,000 restaurants in 130 countries under brand names such as KFC, Pizza Hut, and Taco Bell. Growth in the number of retail stores had been one of the primary drivers of Starbucks growth in revenues. The most significant area of expansion of the Starbucks model in recent years has been the rapid growth in the number of licensed retail stores. At the end of fiscal 1999, Starbucks had only 363 licensed stores, but by the end of fiscal 2012, the number of licensed stores had mushroomed to 8,661. Recent Performance Performance in recent years caused Kim to question whether Starbucks had already reached (or perhaps exceeded) its full potential. She wondered whether it could generate the impressive growth in new stores and revenues that it had created in the past. In fiscal year 2008, Starbucks opened 1,669 net new retail locations (698 net new company-owned stores and 971 new licensed stores), but this number was well below the initial target of 2,500 new stores and well below the 2,571 new stores opened in 2007. Late in 2008, Starbucks announced a plan to close approximately 600 underperforming stores in the United States as well as 64 underperforming stores in Australia. The store closings triggered restructuring charges that reduced Starbucks operating income by 266.9 million in 2008. During fiscal 2009, they increased the restructuring plan to close a total of approximately 800 U.S. stores (an increase of 200), and managed to close 566 U.S. stores during the year. They also announced a plan to close 100 stores in various international markets. The 2009 store closings triggered additional restructuring charges that reduced Starbucks operating income by 332.4 million in 2009. In 2009, for the first time in company history, Starbucks net store growth was negative, with a net of 474 stores closed in the United States (92 stores opened net of 566 closed) and only 89 net new international stores opened (130 stores opened net of 41 closed), for a net total closure of 385 company operated stores. In fiscal 2009, total revenues fell to 9,775 billion from 10,383 billion in fiscal 2008. Fiscal 2009 marked the first year of revenue decline (5.9%) in company history. Prior to 2009, Star-bucks had generated impressive revenue growth rates of 10.3% in fiscal 2008; 20.9% growth in fiscal 2007; and 22.2% in fiscal 2006. Starbucks revenue growth is not just driven by opening new stores; it is also driven by sales growth among existing stores. Through 2007, Starbucks could boast of a streak of 16 consecutive years in which it achieved comparable store sales growth rates equal to or greater than 5%, but that string was broken with negative 3% comparable store sales growth in 2008. Unfortunately, things got worse in 2009, because Starbucks company-operated stores generated a negative 6% growth in comparable U.S. store sales, a negative 2% growth in comparable international store sales, and a negative 6% growth in comparable store sales overall. In response to the downturn in Starbucks business, in January, 2009, Howard Schultz returned from retirement and reassumed his role as president and CEO of Starbucks in order to restructure the business and its potential for growth. Focal points of his transformation plan included taking a more disciplined approach to new store openings, reinvigorating the Star-bucks Experience, developing and implementing even better service and quality, while cutting operating and overhead costs. In addition, the transformation plans included introducing more new beverage and food offerings, such as baked goods, breakfast items and chilled and other foods. A key to Starbucks profit growth lies in increasing same store sales growth via new products. Starbucks regularly introduces new specialty coffee-based drinks and coffee flavors, as well as iced coffee-based drinks, such as the very successful line of Frappuccino drinks and Shaken Iced Refreshment drinks. Under Schultzs renewed leadership, comparable store sales growth rebounded impressively, to 7% growth among U.S. stores and 6% among international stores. Starbucks store openings were very conservative in 2010, owing in part to the difficult economic conditions in the primary markets. In the United States, Starbucks only opened a net 3 new stores in 2010opening 60 licensed stores while closing 57 company-owned stores. Internationally, Star-bucks opened 220 new stores in 2010opening 235 licensed stores while closing 15 company-owned stores. Overall revenue growth also rebounded, reaching 10.7 billion (up 9.5% from 2009). Starbucks continued this modest new store growth trajectory into 2011. Among company-owned stores, Starbucks opened 49 but closed 51 in the United States and opened 180 but closed 36 international stores. Starbucks licensees opened 345 new stores internationally and 133 new stores in the United States. Unfortunately, because Borders Bookstores went bankrupt in 2011, it closed the 475 Starbucks stores that it had licensed. This caused a net negative growth of 342 licensee closings in 2011 in the United States. Overall revenue again sustained healthy growth, with total revenues reaching 11.7 billion (up 9.3% from 2010). Kim was even more encouraged with Starbucks growth in fiscal 2012. During that period, Starbucks opened a total of 1,063 new stores. Of those, Starbucks opened 234 company-owned and 270 licensed stores in the Americas. In the EMEA region, Starbucks opened 10 company-owned and 101 licensed stores, as well as 154 company-owned and 294 licensed stores in the CAP region. Overall revenue reached 13.3 billion (up 14% from 2011). Starbucks also continues to expand the scope of its business model through new channel development in order to reach customers where they work, travel, shop, and dine. To further expand the business model, Starbucks terminated its licensing and distribution agreement with Kraft Foods and now manages its own marketing and distribution of Starbucks whole bean and ground coffee to grocery stores and warehouse club stores. By the end of fiscal 2012, Star-bucks whole bean and ground coffees were available throughout the United States in approximately 39,000 grocery and warehouse club stores. Further, Starbucks sells whole bean and ground coffee through institutional foodservice companies that service business, education, office, hotel, restaurant, airline, and other foodservice accounts. For example, in 2012 Starbucks (and their subsidiary, Seattles Best Coffee) were the only superpremium national brand coffees promoted by Sysco Corporation to such foodservice accounts. Finally, Starbucks had formed partnerships to produce and distribute bottled Frappuccino and DoubleShot drinks with PepsiCo and premium ice creams with Unilever. Despite Starbucks past difficulties with store closings, restructuring charges, and negative comparable store sales growth rates, Kim could see some very positive aspects of Starbucks financial performance and condition. She noted that Starbucks had been profitable in 2008 and 2009, despite the difficulties. She also noted that Starbucks generated record high profits in 2010, 2011, and 2012, suggesting the restructuring and turnaround efforts were proving successful. The restructuring plan was seemingly complete and had helped Starbucks to reduce costs. Further, she noted that Starbucks operating cash flows had remained fairly strong throughout this period. With its positive operating cash flows, Starbucks had retired all of the 713 million in commercial paper and short-term borrowings during 2009, initiated the first dividend in company history in 2010, resumed repurchasing common shares in 2010, and had grown the combined balances in cash and short-term investments over 2.0 billion by fiscal year-end 2012. Product Supply Starbucks purchases green coffee beans from coffee-producing regions around the world and custom roasts and blends them to its exacting standards. Although coffee beans trade in commodity markets and experience volatile prices, Starbucks purchases higher-quality coffee beans that sell at a premium to commodity coffees. Starbucks purchases its coffee beans under fixed-price purchase contracts with various suppliers, with purchase prices reset annually. Starbucks also purchases significant amounts of dairy products from suppliers located near its retail stores. Starbucks purchases paper and plastic products from several suppliers, the prices of which vary with changes in the prices of commodity paper and plastic resin. Competition in the Specialty Coffee Industry After some reflection, Kim realized that Starbucks faced intense direct competition. Kim could think of a wide array of convenient retail locations where a person can purchase a cup of coffee. Kim reasoned that Starbucks competes with a broad scope of coffee beverage retailers, including fast-food chains (for example, McDonalds), doughnut chains (for example, Krispy Kreme, Dunkin Donuts, and Tim Hortons), and convenience stores associated with many gas stations, but that these types of outlets offer an experience that is very different from what Starbucks offers. In particular, Kim was aware that McDonald's had started to expand development of its McCaf shops, which sold premium coffee drinks (lattes, cappuccinos, and mochas) in McDonalds restaurants. It appeared to Kim that the McCaf initiative was intended to be a direct competitive challenge to Starbucks business. Kim also identified a number of companies that were growing chains of retail coffee shops that could be compared to Starbucks, including firms such as Panera Bread Company; Diedrich Coffee; New World Restaurant Group, Inc.; and Caribou Coffee Company, Inc. (a privately held firm). However, these firms were much smaller than Starbucks, with the largest among them being the Panera Bread Company, with approximately 1,700 bakery-cafs system-wide at the end of 2012. On the other end of the spectrum, Kim was aware that Starbucks faced competition from local independent coffee shops and cafs. Kim recognized that despite facing extensive competition, Starbucks had some distinct competitive advantages. Very few companies were implementing a business strategy comparable to that of Starbucks, with emphasis on the quality of the experience, the products, and the service. In addition, only the fast-food chains and the doughnut chains operated on the same scale as Starbucks. Finally, Starbucks had developed a global brand that was synonymous with the quality of the Starbucks experience. Recently, Interbrand ranked the Starbucks brand as one of the worlds top 100 most valuable brand names, estimating it to be worth in excess of 4 billion. The Valuation Controversy In beginning to research Starbucks share price (ticker: SBUX), Kim realized that it had experienced a wild ride over the past five years, following a very similar pattern to Starbucks earnings performance during that time. Starbucks had been one of the hottest companies in the capital market, in large part due to its impressive growth in sales and earnings, up until December of 2006. SBUXs share price had appreciated dramatically, generating cumulative returns that far exceeded those of the SP 500 over that period. The market for Starbucks shares cooled beginning in early 2007, with share prices falling from a high of nearly 40 to a low of under 8 in November of 2008. Since that low point, Starbucks share price began a dramatic recovery. Over the calendar year 2012, SBUX stock price ranged between 42 and 62 per share, and was currently trading at 50 per share, implying a PE ratio of over 28 (based on trailing 12 months earnings per share of 1.79), an earnings multiple that is well above the industry average. Kim further discovered that the capital markets and analysts have mixed opinions on the SBUX stock value. Kim found one-year-ahead price targets from 24 analysts, ranging from a low of 49 to a high of 65, with a mean (median) price target of 59 (60). She found that 30 analysts issued investment recommendations for SBUX: eleven recommend strong buy, ten recommend buy, nine recommend hold, and no analysts recommend sell. The consensus analysts earnings per share forecasts are 2.15 for fiscal 2013 and 2.62 for fiscal 2014. Financial Statements Exhibit 126 presents comparative balance sheets. Exhibit 1.27 presents comparative income statements, and Exhibit 1.28 (pages 7677) presents comparative statements of cash flows for Starbucks for the four fiscal years ending September 30, 2012. Why does net income differ from the amount of cash flow from operating activities?arrow_forwardStarbucks The first case at the end of this chapter and numerous subsequent chapters is a series of integrative cases involving Starbucks. The series of cases applies the concepts and analytical tools discussed in each chapter to Starbucks financial statements and notes. The preparation of responses to the questions in these cases results in an integrated illustration of the six sequential steps in financial statement analysis discussed in this chapter and throughout the book. Introduction They dont just sell coffee; they sell the Starbucks Experience, remarked Deb Mills while sitting down to enjoy a cup of Starbucks cappuccino with her friend Kim Shannon. Kim, an investment fund manager for a large insurance firm, reflected on that observation and what it might mean for Starbucks as a potential investment opportunity. Glancing around the store, Kim saw a number of people sitting alone or in groups, lingering over their drinks while chatting, reading, or checking e-mail and surfing the Internet through the stores wi-fi network. Kim noted that in addition to the wide selection of hot coffees, French and Italian style espressos, teas, and cold coffee-blended drinks, Starbucks also offered food items and baked goods, packages of roasted coffee beans, coffee-related accessories and equipment, and even its own line of CDs. Intrigued, Kim made a mental note to do a full financial statement and valuation analysis of Starbucks to evaluate whether its business model and common equity shares were as good as their coffee. Growth Strategy Kims research quickly confirmed her friends observation that Starbucks is about the experience of enjoying a good cup of coffee. The Starbucks 2012 Form 10-K (page 3) asserts the following: Our retail objective is to be the leading retailer and brand of coffee in each of our target markets by selling the finest quality coffee and related products, and by providing each customer a unique Starbucks Experience. The Starbucks Experience is built upon superior customer service as well as clean and well-maintained company operated stores that reflect the personalities of the communities in which they operate, thereby building a high degree of customer loyalty. The Starbucks experience strives to create a third placesomewhere besides home and work where a customer can feel comfortable and welcomethrough friendly and skilled customer service in clean and personable retail store environments. This approach enabled Starbucks to grow rapidly from just a single store near Pikes Place Market in Seattle to a global company with 18,066 locations worldwide at the end of fiscal 2012. Of that total, Starbucks owned and operated 9,405 stores (7,857 stores in the Americas; 882 stores in the Europe, Middle East Africa (EMEA) region; and 666 stores in the China and Asia Pacific (CAP) region). In addition, licensees owned and operated a total of 8,661 stores (5,046 stores in the Americas; 987 stores in the EMEA region; and 2,628 stores in the CAP region). Most of Starbucks stores at the end of fiscal 2012 were located in the United States, amounting to one Starbucks retail location for every 28,000 U.S. residents. However, Starbucks was clearly not a company content to focus simply on the U.S. market, as it was extending the reach of its stores globally, with thousands of stores outside the United States. At the end of fiscal 2012, Starbucks owned and operated stores in a number of countries around the world, including 878 stores in Canada, 593 stores in the United Kingdom, and 408 stores in China. Starbucks success can be attributed in part to its successful development and expansion of a European ideaenjoying a fine coffee-based beverage and sharing that experience with others in a comfortable, friendly environment with pleasant, competent service. Starbucks imported the idea of the French and Italian caf into the busy North American lifestyle. Ironically, Starbucks successfully extended its brand and style of a caf into the European continent. On January 16, 2004, Starbucks opened its first coffeehouse in Francein the heart of Paris at 26 Avenue de IOperaand had a total of 67 stores in France by the end of 2012. The success of Starbucks retail coffeehouse concept is illustrated by the fact that by the end of 2012, Star-bucks had opened over 1,100 company-operated and licensed locations in Europe, with the majority of them in the United Kingdom. Not long ago, Starbucks CEO Howard Schultz stated that his vision and ultimate goal for Starbucks was to have 20,000 Starbucks retail locations in the United States, to have another 20,000 retail locations in international markets worldwide, and to have Starbucks recognized among the worlds leading brands. Kim Shannon wondered whether Starbucks could ultimately achieve that level of global penetration because she could name only a few such worldwide companies. Among those that came to mind were McDonalds, with more than 34,000 retail locations in 118 countries; Subway, with more than 34,000 locations in 90 countries; and Yum! Brands, with more than 40,000 restaurants in 130 countries under brand names such as KFC, Pizza Hut, and Taco Bell. Growth in the number of retail stores had been one of the primary drivers of Starbucks growth in revenues. The most significant area of expansion of the Starbucks model in recent years has been the rapid growth in the number of licensed retail stores. At the end of fiscal 1999, Starbucks had only 363 licensed stores, but by the end of fiscal 2012, the number of licensed stores had mushroomed to 8,661. Recent Performance Performance in recent years caused Kim to question whether Starbucks had already reached (or perhaps exceeded) its full potential. She wondered whether it could generate the impressive growth in new stores and revenues that it had created in the past. In fiscal year 2008, Starbucks opened 1,669 net new retail locations (698 net new company-owned stores and 971 new licensed stores), but this number was well below the initial target of 2,500 new stores and well below the 2,571 new stores opened in 2007. Late in 2008, Starbucks announced a plan to close approximately 600 underperforming stores in the United States as well as 64 underperforming stores in Australia. The store closings triggered restructuring charges that reduced Starbucks operating income by 266.9 million in 2008. During fiscal 2009, they increased the restructuring plan to close a total of approximately 800 U.S. stores (an increase of 200), and managed to close 566 U.S. stores during the year. They also announced a plan to close 100 stores in various international markets. The 2009 store closings triggered additional restructuring charges that reduced Starbucks operating income by 332.4 million in 2009. In 2009, for the first time in company history, Starbucks net store growth was negative, with a net of 474 stores closed in the United States (92 stores opened net of 566 closed) and only 89 net new international stores opened (130 stores opened net of 41 closed), for a net total closure of 385 company operated stores. In fiscal 2009, total revenues fell to 9,775 billion from 10,383 billion in fiscal 2008. Fiscal 2009 marked the first year of revenue decline (5.9%) in company history. Prior to 2009, Star-bucks had generated impressive revenue growth rates of 10.3% in fiscal 2008; 20.9% growth in fiscal 2007; and 22.2% in fiscal 2006. Starbucks revenue growth is not just driven by opening new stores; it is also driven by sales growth among existing stores. Through 2007, Starbucks could boast of a streak of 16 consecutive years in which it achieved comparable store sales growth rates equal to or greater than 5%, but that string was broken with negative 3% comparable store sales growth in 2008. Unfortunately, things got worse in 2009, because Starbucks company-operated stores generated a negative 6% growth in comparable U.S. store sales, a negative 2% growth in comparable international store sales, and a negative 6% growth in comparable store sales overall. In response to the downturn in Starbucks business, in January, 2009, Howard Schultz returned from retirement and reassumed his role as president and CEO of Starbucks in order to restructure the business and its potential for growth. Focal points of his transformation plan included taking a more disciplined approach to new store openings, reinvigorating the Star-bucks Experience, developing and implementing even better service and quality, while cutting operating and overhead costs. In addition, the transformation plans included introducing more new beverage and food offerings, such as baked goods, breakfast items and chilled and other foods. A key to Starbucks profit growth lies in increasing same store sales growth via new products. Starbucks regularly introduces new specialty coffee-based drinks and coffee flavors, as well as iced coffee-based drinks, such as the very successful line of Frappuccino drinks and Shaken Iced Refreshment drinks. Under Schultzs renewed leadership, comparable store sales growth rebounded impressively, to 7% growth among U.S. stores and 6% among international stores. Starbucks store openings were very conservative in 2010, owing in part to the difficult economic conditions in the primary markets. In the United States, Starbucks only opened a net 3 new stores in 2010opening 60 licensed stores while closing 57 company-owned stores. Internationally, Star-bucks opened 220 new stores in 2010opening 235 licensed stores while closing 15 company-owned stores. Overall revenue growth also rebounded, reaching 10.7 billion (up 9.5% from 2009). Starbucks continued this modest new store growth trajectory into 2011. Among company-owned stores, Starbucks opened 49 but closed 51 in the United States and opened 180 but closed 36 international stores. Starbucks licensees opened 345 new stores internationally and 133 new stores in the United States. Unfortunately, because Borders Bookstores went bankrupt in 2011, it closed the 475 Starbucks stores that it had licensed. This caused a net negative growth of 342 licensee closings in 2011 in the United States. Overall revenue again sustained healthy growth, with total revenues reaching 11.7 billion (up 9.3% from 2010). Kim was even more encouraged with Starbucks growth in fiscal 2012. During that period, Starbucks opened a total of 1,063 new stores. Of those, Starbucks opened 234 company-owned and 270 licensed stores in the Americas. In the EMEA region, Starbucks opened 10 company-owned and 101 licensed stores, as well as 154 company-owned and 294 licensed stores in the CAP region. Overall revenue reached 13.3 billion (up 14% from 2011). Starbucks also continues to expand the scope of its business model through new channel development in order to reach customers where they work, travel, shop, and dine. To further expand the business model, Starbucks terminated its licensing and distribution agreement with Kraft Foods and now manages its own marketing and distribution of Starbucks whole bean and ground coffee to grocery stores and warehouse club stores. By the end of fiscal 2012, Star-bucks whole bean and ground coffees were available throughout the United States in approximately 39,000 grocery and warehouse club stores. Further, Starbucks sells whole bean and ground coffee through institutional foodservice companies that service business, education, office, hotel, restaurant, airline, and other foodservice accounts. For example, in 2012 Starbucks (and their subsidiary, Seattles Best Coffee) were the only superpremium national brand coffees promoted by Sysco Corporation to such foodservice accounts. Finally, Starbucks had formed partnerships to produce and distribute bottled Frappuccino and DoubleShot drinks with PepsiCo and premium ice creams with Unilever. Despite Starbucks past difficulties with store closings, restructuring charges, and negative comparable store sales growth rates, Kim could see some very positive aspects of Starbucks financial performance and condition. She noted that Starbucks had been profitable in 2008 and 2009, despite the difficulties. She also noted that Starbucks generated record high profits in 2010, 2011, and 2012, suggesting the restructuring and turnaround efforts were proving successful. The restructuring plan was seemingly complete and had helped Starbucks to reduce costs. Further, she noted that Starbucks operating cash flows had remained fairly strong throughout this period. With its positive operating cash flows, Starbucks had retired all of the 713 million in commercial paper and short-term borrowings during 2009, initiated the first dividend in company history in 2010, resumed repurchasing common shares in 2010, and had grown the combined balances in cash and short-term investments over 2.0 billion by fiscal year-end 2012. Product Supply Starbucks purchases green coffee beans from coffee-producing regions around the world and custom roasts and blends them to its exacting standards. Although coffee beans trade in commodity markets and experience volatile prices, Starbucks purchases higher-quality coffee beans that sell at a premium to commodity coffees. Starbucks purchases its coffee beans under fixed-price purchase contracts with various suppliers, with purchase prices reset annually. Starbucks also purchases significant amounts of dairy products from suppliers located near its retail stores. Starbucks purchases paper and plastic products from several suppliers, the prices of which vary with changes in the prices of commodity paper and plastic resin. Competition in the Specialty Coffee Industry After some reflection, Kim realized that Starbucks faced intense direct competition. Kim could think of a wide array of convenient retail locations where a person can purchase a cup of coffee. Kim reasoned that Starbucks competes with a broad scope of coffee beverage retailers, including fast-food chains (for example, McDonalds), doughnut chains (for example, Krispy Kreme, Dunkin Donuts, and Tim Hortons), and convenience stores associated with many gas stations, but that these types of outlets offer an experience that is very different from what Starbucks offers. In particular, Kim was aware that McDonald's had started to expand development of its McCaf shops, which sold premium coffee drinks (lattes, cappuccinos, and mochas) in McDonalds restaurants. It appeared to Kim that the McCaf initiative was intended to be a direct competitive challenge to Starbucks business. Kim also identified a number of companies that were growing chains of retail coffee shops that could be compared to Starbucks, including firms such as Panera Bread Company; Diedrich Coffee; New World Restaurant Group, Inc.; and Caribou Coffee Company, Inc. (a privately held firm). However, these firms were much smaller than Starbucks, with the largest among them being the Panera Bread Company, with approximately 1,700 bakery-cafs system-wide at the end of 2012. On the other end of the spectrum, Kim was aware that Starbucks faced competition from local independent coffee shops and cafs. Kim recognized that despite facing extensive competition, Starbucks had some distinct competitive advantages. Very few companies were implementing a business strategy comparable to that of Starbucks, with emphasis on the quality of the experience, the products, and the service. In addition, only the fast-food chains and the doughnut chains operated on the same scale as Starbucks. Finally, Starbucks had developed a global brand that was synonymous with the quality of the Starbucks experience. Recently, Interbrand ranked the Starbucks brand as one of the worlds top 100 most valuable brand names, estimating it to be worth in excess of 4 billion. The Valuation Controversy In beginning to research Starbucks share price (ticker: SBUX), Kim realized that it had experienced a wild ride over the past five years, following a very similar pattern to Starbucks earnings performance during that time. Starbucks had been one of the hottest companies in the capital market, in large part due to its impressive growth in sales and earnings, up until December of 2006. SBUXs share price had appreciated dramatically, generating cumulative returns that far exceeded those of the SP 500 over that period. The market for Starbucks shares cooled beginning in early 2007, with share prices falling from a high of nearly 40 to a low of under 8 in November of 2008. Since that low point, Starbucks share price began a dramatic recovery. Over the calendar year 2012, SBUX stock price ranged between 42 and 62 per share, and was currently trading at 50 per share, implying a PE ratio of over 28 (based on trailing 12 months earnings per share of 1.79), an earnings multiple that is well above the industry average. Kim further discovered that the capital markets and analysts have mixed opinions on the SBUX stock value. Kim found one-year-ahead price targets from 24 analysts, ranging from a low of 49 to a high of 65, with a mean (median) price target of 59 (60). She found that 30 analysts issued investment recommendations for SBUX: eleven recommend strong buy, ten recommend buy, nine recommend hold, and no analysts recommend sell. The consensus analysts earnings per share forecasts are 2.15 for fiscal 2013 and 2.62 for fiscal 2014. Financial Statements Exhibit 126 presents comparative balance sheets. Exhibit 1.27 presents comparative income statements, and Exhibit 1.28 (pages 7677) presents comparative statements of cash flows for Starbucks for the four fiscal years ending September 30, 2012. Accounts receivable are reported net of allowance for uncollectible accounts. Why? Identify the events or transactions that cause accounts receivable to increases and decrease. Also identify the events or transactions that cause the allowance account to increase and decrease.arrow_forwardStarbucks The first case at the end of this chapter and numerous subsequent chapters is a series of integrative cases involving Starbucks. The series of cases applies the concepts and analytical tools discussed in each chapter to Starbucks financial statements and notes. The preparation of responses to the questions in these cases results in an integrated illustration of the six sequential steps in financial statement analysis discussed in this chapter and throughout the book. Introduction They dont just sell coffee; they sell the Starbucks Experience, remarked Deb Mills while sitting down to enjoy a cup of Starbucks cappuccino with her friend Kim Shannon. Kim, an investment fund manager for a large insurance firm, reflected on that observation and what it might mean for Starbucks as a potential investment opportunity. Glancing around the store, Kim saw a number of people sitting alone or in groups, lingering over their drinks while chatting, reading, or checking e-mail and surfing the Internet through the stores wi-fi network. Kim noted that in addition to the wide selection of hot coffees, French and Italian style espressos, teas, and cold coffee-blended drinks, Starbucks also offered food items and baked goods, packages of roasted coffee beans, coffee-related accessories and equipment, and even its own line of CDs. Intrigued, Kim made a mental note to do a full financial statement and valuation analysis of Starbucks to evaluate whether its business model and common equity shares were as good as their coffee. Growth Strategy Kims research quickly confirmed her friends observation that Starbucks is about the experience of enjoying a good cup of coffee. The Starbucks 2012 Form 10-K (page 3) asserts the following: Our retail objective is to be the leading retailer and brand of coffee in each of our target markets by selling the finest quality coffee and related products, and by providing each customer a unique Starbucks Experience. The Starbucks Experience is built upon superior customer service as well as clean and well-maintained company operated stores that reflect the personalities of the communities in which they operate, thereby building a high degree of customer loyalty. The Starbucks experience strives to create a third placesomewhere besides home and work where a customer can feel comfortable and welcomethrough friendly and skilled customer service in clean and personable retail store environments. This approach enabled Starbucks to grow rapidly from just a single store near Pikes Place Market in Seattle to a global company with 18,066 locations worldwide at the end of fiscal 2012. Of that total, Starbucks owned and operated 9,405 stores (7,857 stores in the Americas; 882 stores in the Europe, Middle East Africa (EMEA) region; and 666 stores in the China and Asia Pacific (CAP) region). In addition, licensees owned and operated a total of 8,661 stores (5,046 stores in the Americas; 987 stores in the EMEA region; and 2,628 stores in the CAP region). Most of Starbucks stores at the end of fiscal 2012 were located in the United States, amounting to one Starbucks retail location for every 28,000 U.S. residents. However, Starbucks was clearly not a company content to focus simply on the U.S. market, as it was extending the reach of its stores globally, with thousands of stores outside the United States. At the end of fiscal 2012, Starbucks owned and operated stores in a number of countries around the world, including 878 stores in Canada, 593 stores in the United Kingdom, and 408 stores in China. Starbucks success can be attributed in part to its successful development and expansion of a European ideaenjoying a fine coffee-based beverage and sharing that experience with others in a comfortable, friendly environment with pleasant, competent service. Starbucks imported the idea of the French and Italian caf into the busy North American lifestyle. Ironically, Starbucks successfully extended its brand and style of a caf into the European continent. On January 16, 2004, Starbucks opened its first coffeehouse in Francein the heart of Paris at 26 Avenue de IOperaand had a total of 67 stores in France by the end of 2012. The success of Starbucks retail coffeehouse concept is illustrated by the fact that by the end of 2012, Star-bucks had opened over 1,100 company-operated and licensed locations in Europe, with the majority of them in the United Kingdom. Not long ago, Starbucks CEO Howard Schultz stated that his vision and ultimate goal for Starbucks was to have 20,000 Starbucks retail locations in the United States, to have another 20,000 retail locations in international markets worldwide, and to have Starbucks recognized among the worlds leading brands. Kim Shannon wondered whether Starbucks could ultimately achieve that level of global penetration because she could name only a few such worldwide companies. Among those that came to mind were McDonalds, with more than 34,000 retail locations in 118 countries; Subway, with more than 34,000 locations in 90 countries; and Yum! Brands, with more than 40,000 restaurants in 130 countries under brand names such as KFC, Pizza Hut, and Taco Bell. Growth in the number of retail stores had been one of the primary drivers of Starbucks growth in revenues. The most significant area of expansion of the Starbucks model in recent years has been the rapid growth in the number of licensed retail stores. At the end of fiscal 1999, Starbucks had only 363 licensed stores, but by the end of fiscal 2012, the number of licensed stores had mushroomed to 8,661. Recent Performance Performance in recent years caused Kim to question whether Starbucks had already reached (or perhaps exceeded) its full potential. She wondered whether it could generate the impressive growth in new stores and revenues that it had created in the past. In fiscal year 2008, Starbucks opened 1,669 net new retail locations (698 net new company-owned stores and 971 new licensed stores), but this number was well below the initial target of 2,500 new stores and well below the 2,571 new stores opened in 2007. Late in 2008, Starbucks announced a plan to close approximately 600 underperforming stores in the United States as well as 64 underperforming stores in Australia. The store closings triggered restructuring charges that reduced Starbucks operating income by 266.9 million in 2008. During fiscal 2009, they increased the restructuring plan to close a total of approximately 800 U.S. stores (an increase of 200), and managed to close 566 U.S. stores during the year. They also announced a plan to close 100 stores in various international markets. The 2009 store closings triggered additional restructuring charges that reduced Starbucks operating income by 332.4 million in 2009. In 2009, for the first time in company history, Starbucks net store growth was negative, with a net of 474 stores closed in the United States (92 stores opened net of 566 closed) and only 89 net new international stores opened (130 stores opened net of 41 closed), for a net total closure of 385 company operated stores. In fiscal 2009, total revenues fell to 9,775 billion from 10,383 billion in fiscal 2008. Fiscal 2009 marked the first year of revenue decline (5.9%) in company history. Prior to 2009, Star-bucks had generated impressive revenue growth rates of 10.3% in fiscal 2008; 20.9% growth in fiscal 2007; and 22.2% in fiscal 2006. Starbucks revenue growth is not just driven by opening new stores; it is also driven by sales growth among existing stores. Through 2007, Starbucks could boast of a streak of 16 consecutive years in which it achieved comparable store sales growth rates equal to or greater than 5%, but that string was broken with negative 3% comparable store sales growth in 2008. Unfortunately, things got worse in 2009, because Starbucks company-operated stores generated a negative 6% growth in comparable U.S. store sales, a negative 2% growth in comparable international store sales, and a negative 6% growth in comparable store sales overall. In response to the downturn in Starbucks business, in January, 2009, Howard Schultz returned from retirement and reassumed his role as president and CEO of Starbucks in order to restructure the business and its potential for growth. Focal points of his transformation plan included taking a more disciplined approach to new store openings, reinvigorating the Star-bucks Experience, developing and implementing even better service and quality, while cutting operating and overhead costs. In addition, the transformation plans included introducing more new beverage and food offerings, such as baked goods, breakfast items and chilled and other foods. A key to Starbucks profit growth lies in increasing same store sales growth via new products. Starbucks regularly introduces new specialty coffee-based drinks and coffee flavors, as well as iced coffee-based drinks, such as the very successful line of Frappuccino drinks and Shaken Iced Refreshment drinks. Under Schultzs renewed leadership, comparable store sales growth rebounded impressively, to 7% growth among U.S. stores and 6% among international stores. Starbucks store openings were very conservative in 2010, owing in part to the difficult economic conditions in the primary markets. In the United States, Starbucks only opened a net 3 new stores in 2010opening 60 licensed stores while closing 57 company-owned stores. Internationally, Star-bucks opened 220 new stores in 2010opening 235 licensed stores while closing 15 company-owned stores. Overall revenue growth also rebounded, reaching 10.7 billion (up 9.5% from 2009). Starbucks continued this modest new store growth trajectory into 2011. Among company-owned stores, Starbucks opened 49 but closed 51 in the United States and opened 180 but closed 36 international stores. Starbucks licensees opened 345 new stores internationally and 133 new stores in the United States. Unfortunately, because Borders Bookstores went bankrupt in 2011, it closed the 475 Starbucks stores that it had licensed. This caused a net negative growth of 342 licensee closings in 2011 in the United States. Overall revenue again sustained healthy growth, with total revenues reaching 11.7 billion (up 9.3% from 2010). Kim was even more encouraged with Starbucks growth in fiscal 2012. During that period, Starbucks opened a total of 1,063 new stores. Of those, Starbucks opened 234 company-owned and 270 licensed stores in the Americas. In the EMEA region, Starbucks opened 10 company-owned and 101 licensed stores, as well as 154 company-owned and 294 licensed stores in the CAP region. Overall revenue reached 13.3 billion (up 14% from 2011). Starbucks also continues to expand the scope of its business model through new channel development in order to reach customers where they work, travel, shop, and dine. To further expand the business model, Starbucks terminated its licensing and distribution agreement with Kraft Foods and now manages its own marketing and distribution of Starbucks whole bean and ground coffee to grocery stores and warehouse club stores. By the end of fiscal 2012, Star-bucks whole bean and ground coffees were available throughout the United States in approximately 39,000 grocery and warehouse club stores. Further, Starbucks sells whole bean and ground coffee through institutional foodservice companies that service business, education, office, hotel, restaurant, airline, and other foodservice accounts. For example, in 2012 Starbucks (and their subsidiary, Seattles Best Coffee) were the only superpremium national brand coffees promoted by Sysco Corporation to such foodservice accounts. Finally, Starbucks had formed partnerships to produce and distribute bottled Frappuccino and DoubleShot drinks with PepsiCo and premium ice creams with Unilever. Despite Starbucks past difficulties with store closings, restructuring charges, and negative comparable store sales growth rates, Kim could see some very positive aspects of Starbucks financial performance and condition. She noted that Starbucks had been profitable in 2008 and 2009, despite the difficulties. She also noted that Starbucks generated record high profits in 2010, 2011, and 2012, suggesting the restructuring and turnaround efforts were proving successful. The restructuring plan was seemingly complete and had helped Starbucks to reduce costs. Further, she noted that Starbucks operating cash flows had remained fairly strong throughout this period. With its positive operating cash flows, Starbucks had retired all of the 713 million in commercial paper and short-term borrowings during 2009, initiated the first dividend in company history in 2010, resumed repurchasing common shares in 2010, and had grown the combined balances in cash and short-term investments over 2.0 billion by fiscal year-end 2012. Product Supply Starbucks purchases green coffee beans from coffee-producing regions around the world and custom roasts and blends them to its exacting standards. Although coffee beans trade in commodity markets and experience volatile prices, Starbucks purchases higher-quality coffee beans that sell at a premium to commodity coffees. Starbucks purchases its coffee beans under fixed-price purchase contracts with various suppliers, with purchase prices reset annually. Starbucks also purchases significant amounts of dairy products from suppliers located near its retail stores. Starbucks purchases paper and plastic products from several suppliers, the prices of which vary with changes in the prices of commodity paper and plastic resin. Competition in the Specialty Coffee Industry After some reflection, Kim realized that Starbucks faced intense direct competition. Kim could think of a wide array of convenient retail locations where a person can purchase a cup of coffee. Kim reasoned that Starbucks competes with a broad scope of coffee beverage retailers, including fast-food chains (for example, McDonalds), doughnut chains (for example, Krispy Kreme, Dunkin Donuts, and Tim Hortons), and convenience stores associated with many gas stations, but that these types of outlets offer an experience that is very different from what Starbucks offers. In particular, Kim was aware that McDonald's had started to expand development of its McCaf shops, which sold premium coffee drinks (lattes, cappuccinos, and mochas) in McDonalds restaurants. It appeared to Kim that the McCaf initiative was intended to be a direct competitive challenge to Starbucks business. Kim also identified a number of companies that were growing chains of retail coffee shops that could be compared to Starbucks, including firms such as Panera Bread Company; Diedrich Coffee; New World Restaurant Group, Inc.; and Caribou Coffee Company, Inc. (a privately held firm). However, these firms were much smaller than Starbucks, with the largest among them being the Panera Bread Company, with approximately 1,700 bakery-cafs system-wide at the end of 2012. On the other end of the spectrum, Kim was aware that Starbucks faced competition from local independent coffee shops and cafs. Kim recognized that despite facing extensive competition, Starbucks had some distinct competitive advantages. Very few companies were implementing a business strategy comparable to that of Starbucks, with emphasis on the quality of the experience, the products, and the service. In addition, only the fast-food chains and the doughnut chains operated on the same scale as Starbucks. Finally, Starbucks had developed a global brand that was synonymous with the quality of the Starbucks experience. Recently, Interbrand ranked the Starbucks brand as one of the worlds top 100 most valuable brand names, estimating it to be worth in excess of 4 billion. The Valuation Controversy In beginning to research Starbucks share price (ticker: SBUX), Kim realized that it had experienced a wild ride over the past five years, following a very similar pattern to Starbucks earnings performance during that time. Starbucks had been one of the hottest companies in the capital market, in large part due to its impressive growth in sales and earnings, up until December of 2006. SBUXs share price had appreciated dramatically, generating cumulative returns that far exceeded those of the SP 500 over that period. The market for Starbucks shares cooled beginning in early 2007, with share prices falling from a high of nearly 40 to a low of under 8 in November of 2008. Since that low point, Starbucks share price began a dramatic recovery. Over the calendar year 2012, SBUX stock price ranged between 42 and 62 per share, and was currently trading at 50 per share, implying a PE ratio of over 28 (based on trailing 12 months earnings per share of 1.79), an earnings multiple that is well above the industry average. Kim further discovered that the capital markets and analysts have mixed opinions on the SBUX stock value. Kim found one-year-ahead price targets from 24 analysts, ranging from a low of 49 to a high of 65, with a mean (median) price target of 59 (60). She found that 30 analysts issued investment recommendations for SBUX: eleven recommend strong buy, ten recommend buy, nine recommend hold, and no analysts recommend sell. The consensus analysts earnings per share forecasts are 2.15 for fiscal 2013 and 2.62 for fiscal 2014. Financial Statements Exhibit 126 presents comparative balance sheets. Exhibit 1.27 presents comparative income statements, and Exhibit 1.28 (pages 7677) presents comparative statements of cash flows for Starbucks for the four fiscal years ending September 30, 2012. Why does Starbucks show an increase in inventory as a subtraction when computing cash flow from operations?arrow_forward
arrow_back_ios
SEE MORE QUESTIONS
arrow_forward_ios
Recommended textbooks for you
 Financial Reporting, Financial Statement Analysis...FinanceISBN:9781285190907Author:James M. Wahlen, Stephen P. Baginski, Mark BradshawPublisher:Cengage Learning
 Financial Accounting: The Impact on Decision Make...AccountingISBN:9781305654174Author:Gary A. Porter, Curtis L. NortonPublisher:Cengage Learning
 Survey of Accounting (Accounting I)AccountingISBN:9781305961883Author:Carl WarrenPublisher:Cengage Learning
Financial Reporting, Financial Statement Analysis...
Finance
ISBN:9781285190907
Author:James M. Wahlen, Stephen P. Baginski, Mark Bradshaw
Publisher:Cengage Learning
Financial Accounting: The Impact on Decision Make...
Accounting
ISBN:9781305654174
Author:Gary A. Porter, Curtis L. Norton
Publisher:Cengage Learning
Survey of Accounting (Accounting I)
Accounting
ISBN:9781305961883
Author:Carl Warren
Publisher:Cengage Learning
Topic 6 - Financial statement analysis; Author: drdavebond;https://www.youtube.com/watch?v=uUnP5qkbQ20;License: Standard Youtube License