
MyLab Operations Management with Pearson eText -- Access Card -- for Operations Management: Sustainability and Supply Chain Management
12th Edition
ISBN: 9780134165325
Author: Jay Heizer, Barry Render, Chuck Munson
Publisher: PEARSON
expand_more
expand_more
format_list_bulleted
Concept explainers
Videos
Textbook Question
Chapter 4, Problem 26P
Question
•• 4.27 George Kyparisis owns a company that manufactures sailboats. Actual demand for George’s sailboats during each of the past four seasons was as follows:
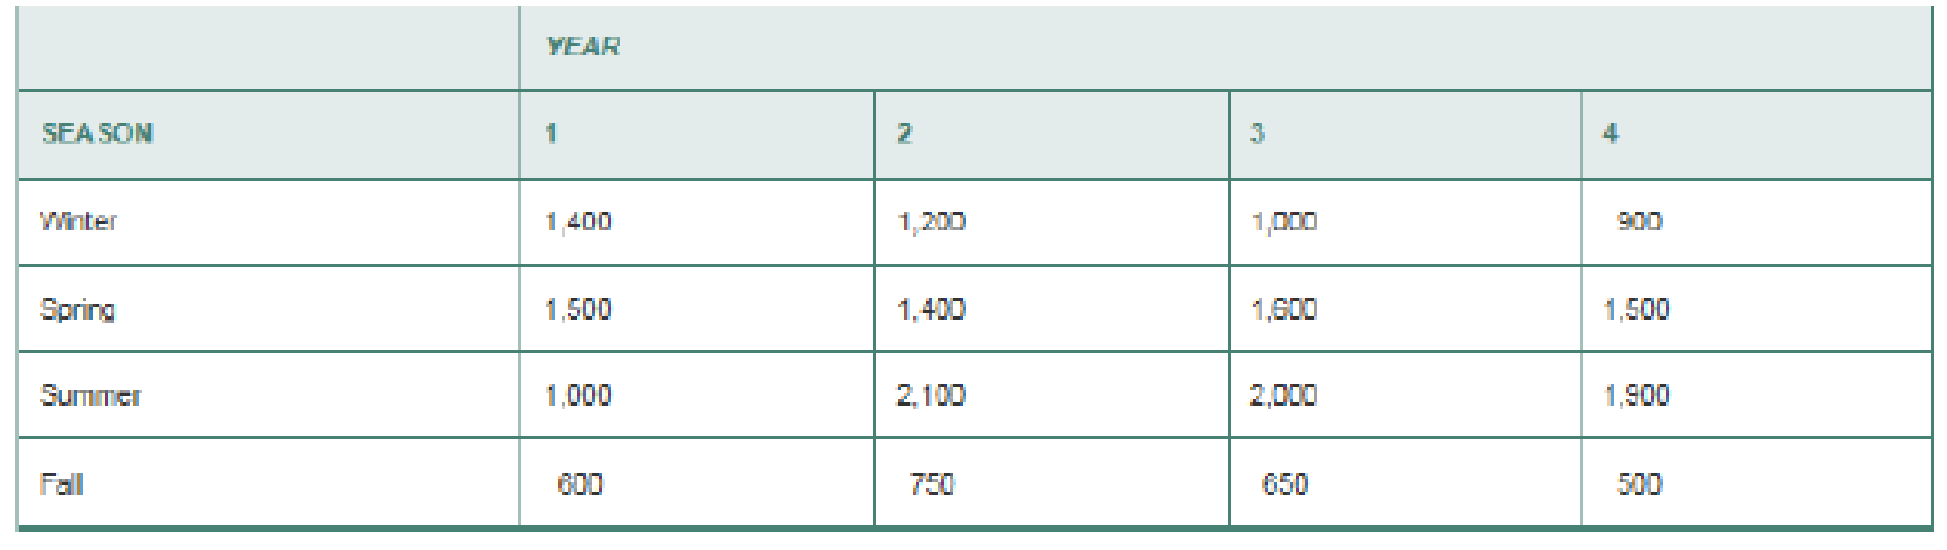
George has
Expert Solution & Answer
Want to see the full answer?
Check out a sample textbook solution
Students have asked these similar questions
Question 2
Historical demand for gulab jamun from a sweet stall on Commercial Road is as displayed in the table.
Month
Demand (orders)
January
66,753
February
67,686
March
68,641
April
68,979
May
69,278
June
69,577
July
69,602
August
70,348
September
70,806
October
71,011
November
71,819
December
72,752
What is the forecast for June using Holt's model with an alpha of 0.1 and a beta of 0.2?
69121
69612
70564
63545
Full explain this question text typing
QUESTION ONE (b) The forecast of a product for the first week of January was 200 units, whereas the actual demand turned out to be 220 units.
i. Find the forecast for the week of January assuming the smoothing constant 0.2 α =
ii. Find the forecast for the third week of third week of January if the actual demand of the second week is 210 units
QUESTION 12
Suppose sales for the past 6 months have been119, 82, 103, 117, 116, and 97 Using a smoothing coefficient of 0.7, what is the exponentially smoothed value for the 3rd period? (please round your answer to 1 decimal place)
Chapter 4 Solutions
MyLab Operations Management with Pearson eText -- Access Card -- for Operations Management: Sustainability and Supply Chain Management
Ch. 4 - What is a qualitative foretasting model, and when...Ch. 4 - Identify and briefly describe the two general...Ch. 4 - Identify the three forecasting time horizons....Ch. 4 - Briefly describe the steps that are used to...Ch. 4 - A skeptical manager asks what medium-range...Ch. 4 - Explain why such forecasting devices as moving...Ch. 4 - What is the basic difference between a weighted...Ch. 4 - What three methods are used to determine the...Ch. 4 - Research and briefly describe the Delphi...Ch. 4 - What is the primary difference between a...
Ch. 4 - Define time series.Ch. 4 - What effect does the value of the smoothing...Ch. 4 - Explain the value of seasonal indices in...Ch. 4 - Which forecasting technique can place the most...Ch. 4 - In your own words, explain adaptive forecasting.Ch. 4 - What is the purpose of a tracking signal?Ch. 4 - Explain, in your own words, the meaning of the...Ch. 4 - What is the difference between a dependent and an...Ch. 4 - Give examples of industries that are affected by...Ch. 4 - Give examples of industries in which demand...Ch. 4 - Prob. 21DQCh. 4 - Prob. 22DQCh. 4 - The following gives the number of pints of type B...Ch. 4 - 4.2 a. Plot the above data on a graph. Do you...Ch. 4 - Refer to Problem 4.2. Develop a forecast for years...Ch. 4 - A check-processing center uses exponential...Ch. 4 - The Carbondale Hospital is considering the...Ch. 4 - The monthly sales for Yazici Batteries, Inc., were...Ch. 4 - The actual demand for the patients at Omaha...Ch. 4 - Daily high temperatures in St. Louis for the last...Ch. 4 - Lenovo uses the ZX-81 chip in some of its laptop...Ch. 4 - Data collected on the yearly registrations for a...Ch. 4 - Use exponential smoothing with a smoothing...Ch. 4 - Consider the following actual and forecast demand...Ch. 4 - As you can see in the following table, demand for...Ch. 4 - Following are two weekly forecasts made by two...Ch. 4 - Refer to Solved Problem 4.1 on page 138. a. Use a...Ch. 4 - Solved example 4.1 Sales of Volkswagens popular...Ch. 4 - Refer to Solved Problem 4.1. Using smoothing...Ch. 4 - Consider the following actual (At) and forecast...Ch. 4 - Income at the architectural firm Spraggins and...Ch. 4 - Question 4.20 Resolve Problem 4.19 with =.1 and ...Ch. 4 - Question 4.21 Refer to the trend-adjusted...Ch. 4 - Question 4.22 Refer to Problem 4.21. Complete the...Ch. 4 - Question 4.23 Sales of quilt covers at Bud Baniss...Ch. 4 - Question 4.25 The following gives the number of...Ch. 4 - Prob. 25PCh. 4 - Question 4.27 George Kyparisis owns a company...Ch. 4 - Question 4.28 Attendance at Orlandos newest...Ch. 4 - Question 4.29 North Dakota Electric Company...Ch. 4 - Question 4.33 The number of internal disk drives...Ch. 4 - Dr. Lillian Fok, a New Orleans psychologist,...Ch. 4 - Emergency calls to the 911 system of Durham, North...Ch. 4 - Using the 911 call data in Problem 4.43, forecast...Ch. 4 - Question 4.47 Storrs Cycles has just started...Ch. 4 - Question 4.49 Boulanger Savings and Loan is proud...Ch. 4 - Question 4.24 Mark Gershon, owner of a musical...Ch. 4 - Lori Cook has developed the following forecasting...Ch. 4 - Prob. 45PCh. 4 - Question 4.32 The following data relate the sales...Ch. 4 - Question 4.34 The number of auto accidents in...Ch. 4 - Question 4.35 Rhonda Clark, a Slippery Rock,...Ch. 4 - Accountants at the Tucson firm, Larry Youdelman,...Ch. 4 - Sales of tablet computers at Ted Glickmans...Ch. 4 - Question 4.38 City government has collected the...Ch. 4 - Using the data in Problem 4.39, apply linear...Ch. 4 - Bus and subway ridership for the summer months in...Ch. 4 - Thirteen students entered the business program at...Ch. 4 - Question 4.48 Dave Fletcher, the general manager...Ch. 4 - The following are monthly actual and forecast...Ch. 4 - Prob. 1CSCh. 4 - Prob. 2CSCh. 4 - Prob. 3CSCh. 4 - For its first 2 decades of existence, the NBAs...Ch. 4 - For its first 2 decades of existence, the NBAs...Ch. 4 - For its first 2 decades of existence, the NBAs...Ch. 4 - For its first 2 decades of existence, the NBAs...Ch. 4 - Forecasting at Hard Rock Cafe Video Case With the...Ch. 4 - Forecasting at Hard Rock Cafe Video Case With the...Ch. 4 - Forecasting at Hard Rock Cafe Video Case With the...Ch. 4 - Forecasting at Hard Rock Cafe Video Case With the...Ch. 4 - Forecasting at Hard Rock Cafe Video Case With the...
Knowledge Booster


Learn more about
Need a deep-dive on the concept behind this application? Look no further. Learn more about this topic, operations-management and related others by exploring similar questions and additional content below.Similar questions
- Question 4 The below data represent the advertising expenditure and sales of Little Liu Ltd from year 2008 to 2017. Table: Advertising Expenditure vs. Sales from 2008 to 2017 Year Advert. Expenditure Sales (x, £000) (y, £000) 2008 8 30 2009 12 40 2010 11 29 2011 5 29 2012 14 43 2013 3 17 2014 6 20 2015 8 30 2016 4 22 2017 9 40 Total 80 300 Work out the values of parameters of the relationship shown in the Figure (i.e. work out the equation of the relationship).arrow_forwardQuestion 6 Tech Company is a medium-sized consumer electronics retailer. The company reported $155,000,000 in revenues for 2007 and $110,050,000 in Costs of Goods Sold (COGS). In the same year, Tech Co. held an average of $20,000,000 in inventory. How many times did Tech Co. turn its inventory in 2007?arrow_forwardQUESTION 1 Sales of Fat Lips Burgers for 2012 are shown in the table below. 1. Do the 2 month SMA forecast 2. Do 2 month WMA forecast using the information below WMA – 2: last month, 1 – last 2 months 3. For the month of January 2012, the forecast was 438. Do the EMA forecast with the smoothing constant = 0.3. What is the forecast for Jan 2013? 4. Compare the forecasts above using MAD, MSE and MAPE. Which forecast method gives the least errors? Month Actual Sales Forecast Jan 2012 438 Feb 420 March 414 Apr 318 May 306 June 240 July 240 Aug 216 Sep 198 Oct 225 Nov 270 Dec 315 Jan 2013 - QUESTION 2Dayang sells 5 kg bags of fertilizer to local farmers in Tg Karang. The sales data for the past 11 months is shown below. Month Demand (10s of bags) 1 4 2 6 3 4 4 5 5 10 6 8 7 7 8 9 9 12 10 14 11 15 1. Find the forecast for the month 12 using the methods below: a. Simple 4 month moving average (SMA) b.…arrow_forward
- Question Four: ABC Company sells home appliances. Daily sales for a six-day period were as follows: Day Sales Saturday 20 Sunday 24 Monday 30 Tuesday 40 Wednesday 36 Thursday 44 Forecast Friday sales volume using each of the following methods: A three-day moving average. A four day weighted average using weights of 0.1, 0.2, 0.3 and 0.4 Exponential smoothing with a smoothing constant equal to 0.2, assuming Wednesday forecast of 42. Determine a linear trend line equation for ABC Company. Use the trend equation to forecast Friday sales volume.arrow_forwardQuestion 1 Samsung Electronics Co. Ltd said on Thursday it expects chip shortages to affect chip demand from some customers in the final three months of the year, after reporting its highest quarterly profit in three years. The warning comes as producers of goods from televisions to cars have faced a host of supply chain issues ranging from a shortage of logic chip parts, manpower shortages, logistics snarls, and delays at parts plants due to power cuts in China. Samsung said demand for server DRAM chips, which temporarily save data, and NAND flash chips that serve the data storage market, is expected to stay robust in the fourth quarter due to expansion of data centre investments. Although supply chain issues could limit demand from some mobile chip customers in the fourth quarter, demand for server and personal computer chips is expected to be robust in 2022 despite uncertainties, it said. Analysts expect Samsung's fourth quarter earnings to be level or below its third quarter…arrow_forwardQUESTION 2 In the airline market, vacation-traveler customers have a more elastic demand than business-traveler customers, although the marginal cost of serving either type of customer is the same. If the airline companies engage in price discrimination, which customers end up paying a higher price? Vacation-traveler customers. Prices will be the same because the marginal costs are the same. There is not enough information to answer. We also need to know the average cost of serving each type of customer. Business-traveler customers. QUESTION 3 A seller engages in price discrimination by market segment. Morning customers have a price elasticity of demand E = -2, while evening customers have a price elasticity of demand E = -3. The MC of selling to both groups is the same and constant at $100. Therefore: morning customers will pay P=$400, while evening customers will pay $300. morning customers will pay P=$400, while evening…arrow_forward
- Question 3 [Soalan 3] Use the data set below to answer the following questions: [Gunakan set data di bawah untuk menjawab soalan-soalan berikut:] Table 1: Monthly sales unit [Jadual 1: Unit jualan bulanan] Month [Bulan] Sales Units [Unit Jualan] 1 1100 2 1200 3 1450 4 1800 5 2100 6 2700 ii) Calculate the four-period weighted moving average forecasts for months 5 and 6 using weights of 0.05, 0.15, 0.30, and 0.50 from the earliest period to the latest period, respectively. [Hitungkan ramalan wajaran purata bergerak menggunakan empat-tempoh untuk bulan 5 dan 6 menggunakan pemberat 0.05, 0.15, 0.30 dan 0.50 dari tempoh yang terawal ke tempoh yang terakhir mengikut turutan.]arrow_forwardQUESTION THREE (a) The actual demand of a product for 6 months are summarized in Table below: Actual Demand Values Month ( ) t Demand ( ) tD 1 300 2 450 3 700 4 900 5 1200 6 1400 i. Find three months weighted moving averages by assuming the weights 1 0.15 W = , 2 0.36W = and 3 0.49 W = . ii. Compute the mean forecast errors. iii. Compute the mean square errorarrow_forwardQUESTION 11 Suppose sales for the past 6 months have been98, 113, 94, 109, 98, and 119 What is the 3-month moving average for the 5th period? (please round your answer to 1 decimal place)arrow_forward
- Question #2 Month Demand 1 45 2 48 3 43 4 48 5 49 6 54 7 47 8 50 9 46 10 47 Using the table above, calculate two forecasts using the following method:- First, for periods 4 through 10, develop the exponentially smoothed forecasts using a forecast for period 3 (F3) of 45.0 and an alpha of 0.4. ii. Calculate the weighted moving average for periods 4 through 10, using weights of .70, .20, and .10, with 0.70 applied to the most recent data. iii. Calculate the mean absolute deviation (MAD) for each forecasting procedure. Which forecasting procedure would you select? Why?arrow_forwardQUESTION ONEIn August 2020 government through the Republican President, Zambia launched a K470 million Multi sectoral youth empowerment programme. The Head of State said during the launch in Ndola that government will listen more to young people and address their concerns. As a result of this initiative government had identified oil refining as a major business which youths can venture into. Data collected from Indeni oil refinery (specimen) shows that there are two blending processes of which the inputs and outputs per production run are as follows Inputs Outputs Crude A Crude B Petrol Kerosene Process 1 53 58 Process 2 45 44 The maximum amount available of crude A and B is 200 units and 150 units respectively.Market requirements show that at least 100 units of Petrol and 80 units of Kerosenemust be produced. The profits per production run from process 1 and 2 are $3 and $4respectively. You have been hired as a consultant to help these youth groups makerefining a…arrow_forwardQuestion 1. Question : (TCOs 6 and 8) What is the approximate forecast for July using a 40-month moving average if the historical demand is as follows: January is 35, February is 36, March is 40, April is 43, May is 48, and June is 49? 38 45 42 43 39 Question 4. Question : (TCO 8) Given an alpha factor of 0.4, a current demand for April of 5,500 units, and a March forecast of 4,900 units, calculate the May forecast. 4,000 6,050 5,080 4,520 5,140 Question 6. Question : (TCOs 5 and12) With a demand during lead time of 130, a safety stock of 20, and a container size of 30, how many kanbans (containers) would be needed? 6 5 8 10 16 Question 8. Question : (TCOs 6 and 8) In the process of using seasonal indices for forecasting, the first step that is taken is compute the average demand over all months. estimate next year’s total annual demand. divide the estimate of total annual demand by the number of seasons. find the average historical demand each…arrow_forward
arrow_back_ios
SEE MORE QUESTIONS
arrow_forward_ios
Recommended textbooks for you
 Practical Management ScienceOperations ManagementISBN:9781337406659Author:WINSTON, Wayne L.Publisher:Cengage,
 Operations ManagementOperations ManagementISBN:9781259667473Author:William J StevensonPublisher:McGraw-Hill Education
 Operations and Supply Chain Management (Mcgraw-hi...Operations ManagementISBN:9781259666100Author:F. Robert Jacobs, Richard B ChasePublisher:McGraw-Hill Education
 Purchasing and Supply Chain ManagementOperations ManagementISBN:9781285869681Author:Robert M. Monczka, Robert B. Handfield, Larry C. Giunipero, James L. PattersonPublisher:Cengage Learning
 Production and Operations Analysis, Seventh Editi...Operations ManagementISBN:9781478623069Author:Steven Nahmias, Tava Lennon OlsenPublisher:Waveland Press, Inc.
Practical Management Science
Operations Management
ISBN:9781337406659
Author:WINSTON, Wayne L.
Publisher:Cengage,
Operations Management
Operations Management
ISBN:9781259667473
Author:William J Stevenson
Publisher:McGraw-Hill Education
Operations and Supply Chain Management (Mcgraw-hi...
Operations Management
ISBN:9781259666100
Author:F. Robert Jacobs, Richard B Chase
Publisher:McGraw-Hill Education
Purchasing and Supply Chain Management
Operations Management
ISBN:9781285869681
Author:Robert M. Monczka, Robert B. Handfield, Larry C. Giunipero, James L. Patterson
Publisher:Cengage Learning
Production and Operations Analysis, Seventh Editi...
Operations Management
ISBN:9781478623069
Author:Steven Nahmias, Tava Lennon Olsen
Publisher:Waveland Press, Inc.
Introduction to Forecasting; Author: Ekeeda;https://www.youtube.com/watch?v=5eIbVXrJL7k;License: Standard YouTube License, CC-BY