
OPERATIONS MGMT - FIRST DAY
2018th Edition
ISBN: 9780135391242
Author: HEIZER
Publisher: PEARSON
expand_more
expand_more
format_list_bulleted
Videos
Textbook Question
Chapter 4, Problem 27P
Question
•• 4.28 Attendance at Orlando’s newest Disneylike attraction, Lego World, has been as follows:
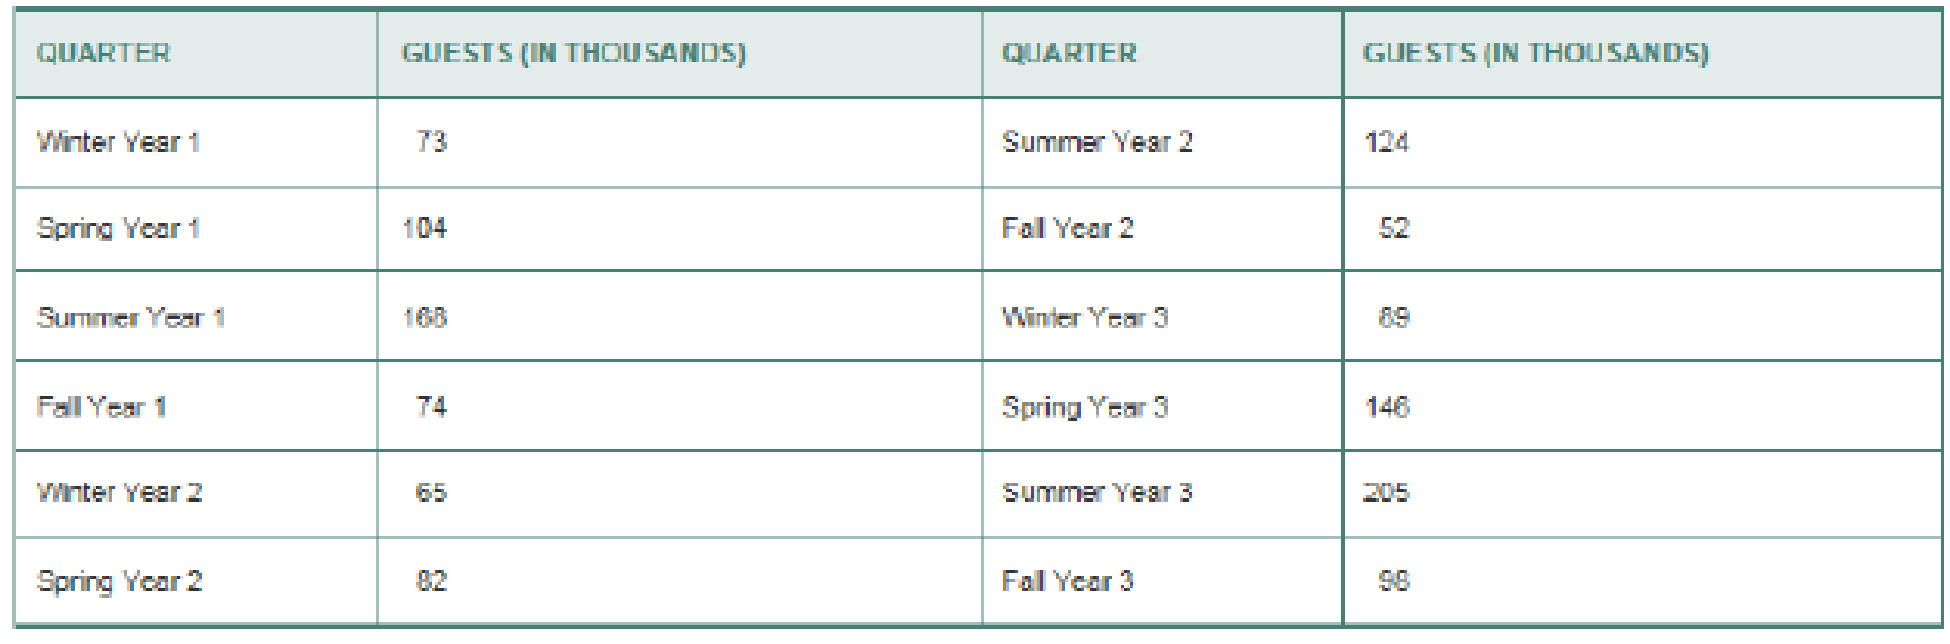
Compute seasonal indices using all of the data.
Expert Solution & Answer
Want to see the full answer?
Check out a sample textbook solution
Students have asked these similar questions
Question
Using a suitable moving average method, find the trend values.
Question 21
A CFE of -140 suggests which of the following?
Group of answer choices
a. There is a bias towards over forecasting, though we cannot determine from the data provided whether that is severe bias or not
b. There is a severe bias towards overforecasting
c. There is a bias towards under forecasting, though we cannot determine from the data provided whether that is severe bias or not
d. There is a severe bias towards under forecasting
e. Bias is negligible in this case
Question 1
Double Exponential Smoothing should be applied to time series with ____________________.
Group of answer choices
a. no trend and no seasonality.
b. trend but no seasonality.
c. seasonality but no trend.
d. both trend and seasonality.
Question 2
An analyst fits a Holt’s Double exponential smoothing model in StatTools to a time series data on sales with the smoothing parameters to be optimized by the software. In the output she notes that the optimized smoothing parameter for trend to be 0.0000. What does this imply?
Group of answer choices
a. There is no trend in the data.
b. There is both trend and seasonality in the data.
c. There could be trend in the data, but it is not smoothed over time by the model.
d. This output does not make any sense!
Chapter 4 Solutions
OPERATIONS MGMT - FIRST DAY
Ch. 4 - What is a qualitative foretasting model, and when...Ch. 4 - Identify and briefly describe the two general...Ch. 4 - Identify the three forecasting time horizons....Ch. 4 - Briefly describe the steps that are used to...Ch. 4 - A skeptical manager asks what medium-range...Ch. 4 - Explain why such forecasting devices as moving...Ch. 4 - What is the basic difference between a weighted...Ch. 4 - What three methods are used to determine the...Ch. 4 - Research and briefly describe the Delphi...Ch. 4 - What is the primary difference between a...
Ch. 4 - Define time series.Ch. 4 - What effect does the value of the smoothing...Ch. 4 - Explain the value of seasonal indices in...Ch. 4 - Which forecasting technique can place the most...Ch. 4 - In your own words, explain adaptive forecasting.Ch. 4 - What is the purpose of a tracking signal?Ch. 4 - Explain, in your own words, the meaning of the...Ch. 4 - What is the difference between a dependent and an...Ch. 4 - Give examples of industries that are affected by...Ch. 4 - Give examples of industries in which demand...Ch. 4 - Prob. 21DQCh. 4 - Prob. 22DQCh. 4 - The following gives the number of pints of type B...Ch. 4 - 4.2 a. Plot the above data on a graph. Do you...Ch. 4 - Refer to Problem 4.2. Develop a forecast for years...Ch. 4 - A check-processing center uses exponential...Ch. 4 - The Carbondale Hospital is considering the...Ch. 4 - The monthly sales for Yazici Batteries, Inc., were...Ch. 4 - The actual demand for the patients at Omaha...Ch. 4 - Daily high temperatures in St. Louis for the last...Ch. 4 - Lenovo uses the ZX-81 chip in some of its laptop...Ch. 4 - Data collected on the yearly registrations for a...Ch. 4 - Use exponential smoothing with a smoothing...Ch. 4 - Consider the following actual and forecast demand...Ch. 4 - As you can see in the following table, demand for...Ch. 4 - Following are two weekly forecasts made by two...Ch. 4 - Refer to Solved Problem 4.1 on page 138. a. Use a...Ch. 4 - Solved example 4.1 Sales of Volkswagens popular...Ch. 4 - Refer to Solved Problem 4.1. Using smoothing...Ch. 4 - Consider the following actual (At) and forecast...Ch. 4 - Income at the architectural firm Spraggins and...Ch. 4 - Question 4.20 Resolve Problem 4.19 with =.1 and ...Ch. 4 - Question 4.21 Refer to the trend-adjusted...Ch. 4 - Question 4.22 Refer to Problem 4.21. Complete the...Ch. 4 - Question 4.23 Sales of quilt covers at Bud Baniss...Ch. 4 - Question 4.25 The following gives the number of...Ch. 4 - Prob. 25PCh. 4 - Question 4.27 George Kyparisis owns a company...Ch. 4 - Question 4.28 Attendance at Orlandos newest...Ch. 4 - Question 4.29 North Dakota Electric Company...Ch. 4 - Question 4.33 The number of internal disk drives...Ch. 4 - Dr. Lillian Fok, a New Orleans psychologist,...Ch. 4 - Emergency calls to the 911 system of Durham, North...Ch. 4 - Using the 911 call data in Problem 4.43, forecast...Ch. 4 - Question 4.47 Storrs Cycles has just started...Ch. 4 - Question 4.49 Boulanger Savings and Loan is proud...Ch. 4 - Question 4.24 Mark Gershon, owner of a musical...Ch. 4 - Lori Cook has developed the following forecasting...Ch. 4 - Prob. 45PCh. 4 - Question 4.32 The following data relate the sales...Ch. 4 - Question 4.34 The number of auto accidents in...Ch. 4 - Question 4.35 Rhonda Clark, a Slippery Rock,...Ch. 4 - Accountants at the Tucson firm, Larry Youdelman,...Ch. 4 - Sales of tablet computers at Ted Glickmans...Ch. 4 - Question 4.38 City government has collected the...Ch. 4 - Using the data in Problem 4.39, apply linear...Ch. 4 - Bus and subway ridership for the summer months in...Ch. 4 - Thirteen students entered the business program at...Ch. 4 - Question 4.48 Dave Fletcher, the general manager...Ch. 4 - The following are monthly actual and forecast...Ch. 4 - Prob. 1CSCh. 4 - Prob. 2CSCh. 4 - Prob. 3CSCh. 4 - For its first 2 decades of existence, the NBAs...Ch. 4 - For its first 2 decades of existence, the NBAs...Ch. 4 - For its first 2 decades of existence, the NBAs...Ch. 4 - For its first 2 decades of existence, the NBAs...Ch. 4 - Forecasting at Hard Rock Cafe Video Case With the...Ch. 4 - Forecasting at Hard Rock Cafe Video Case With the...Ch. 4 - Forecasting at Hard Rock Cafe Video Case With the...Ch. 4 - Forecasting at Hard Rock Cafe Video Case With the...Ch. 4 - Forecasting at Hard Rock Cafe Video Case With the...
Knowledge Booster


Learn more about
Need a deep-dive on the concept behind this application? Look no further. Learn more about this topic, operations-management and related others by exploring similar questions and additional content below.Similar questions
- Question 16 Daily demand for sandwiches at a local deli is shown in the table. Using a 3 period weighted moving average (most recent demands receive the highest weights) with weights W1 = 0.50, W2 = 0.30 and W3 = 0.20, what is the forecast for day 8? Group of answer choices a. 39.3 sandwiches b. 41.3 sandwiches c. 43 sandwiches d. 43.3 sandwiches e. Impossible to determinearrow_forwardQUESTION 34 Suppose the actual sales and the forecasted, or smoothed sales, for the past 5 months have been Actual Smoothed 54.4 76.8 54.4 75.5 72.3 53.2 74.8 39.2 57.6 What is the Mean Absolute Error of the smoothed series? (please round your answer to 1 decimal place)arrow_forwardQuestion 02: Following data set indicates the annual electricity consumption of Sri Lanka in Mega Watt Hours (MWh) from 1996 to 2022. Year Electricity Consumption in MWh1996 1,5881997 1,5581998 1,7531999 1,4082000 1,3102001 1,4242002 1,6772003 1,9372004 1,6852005 1,4882006 1,5622007 1,6192008 1,6872009 1,8412010 1,8652011 1,6372012 1,6532013 1,6992014 1,6982015 1,5232016 1,5572017 1,7952018 1,9342019 2,1252020…arrow_forward
- QUESTION 3 In an effort to reduce energy costs, a major university has installed more efficient lights as well as automatic sensors that turn the lights off when no movement is present in a room. Historically, the cost of lighting an average classroom for 1 week has been $265. To determine whether the changes have signficantly reduced costs, the university takes a sample of 50 classrooms. They find that the average cost for 1 week is $247 with a standard deviation of $60. When testing whether the average energy use has decreased from the past (with a null hypothesis that the use has increased) (using the 5% level of significance), what is the p-value? (please round your answer to 4 decimal places)arrow_forwardQuestion 35 Suppose the actual sales and the forecasted, or smoothed sales, for the past 5 months have been Actual Smoothed 54.4 76.8 54.4 75.5 72.3 53.2 74.8 39.2 57.6 What is the Mean Square Error of the smoothed series? (please round your answer to 1 decimal place)arrow_forwardQuestion Four: ABC Company sells home appliances. Daily sales for a six-day period were as follows: Day Sales Saturday 20 Sunday 24 Monday 30 Tuesday 40 Wednesday 36 Thursday 44 Forecast Friday sales volume using each of the following methods: A three-day moving average. A four day weighted average using weights of 0.1, 0.2, 0.3 and 0.4 Exponential smoothing with a smoothing constant equal to 0.2, assuming Wednesday forecast of 42. Determine a linear trend line equation for ABC Company. Use the trend equation to forecast Friday sales volume.arrow_forward
- Question 4 (a) With reference to your department or one in a company or organization that you are familiar with that is involved in generating forecasts of air cargo traffic, propose the purposes for which the forecasts can be employed. In the process of generating air cargo traffic forecasts, appraise the forces that will promote air freight growth and the constraints the air cargo market are likely to face.arrow_forwardQuestion 6 Which of the following would be considered to have the greatest "lag"? Group of answer choices 5-day Simple Moving Average 10-day Simple Moving Average 50-day Simple Moving Average 25-day Simple Moving Averagearrow_forwardQUESTION ONE (b) The forecast of a product for the first week of January was 200 units, whereas the actual demand turned out to be 220 units. i. Find the forecast for the week of January assuming the smoothing constant 0.2 α = ii. Find the forecast for the third week of third week of January if the actual demand of the second week is 210 unitsarrow_forward
- QUESTION 1 Sales of Fat Lips Burgers for 2012 are shown in the table below. 1. Do the 2 month SMA forecast 2. Do 2 month WMA forecast using the information below WMA – 2: last month, 1 – last 2 months 3. For the month of January 2012, the forecast was 438. Do the EMA forecast with the smoothing constant = 0.3. What is the forecast for Jan 2013? 4. Compare the forecasts above using MAD, MSE and MAPE. Which forecast method gives the least errors? Month Actual Sales Forecast Jan 2012 438 Feb 420 March 414 Apr 318 May 306 June 240 July 240 Aug 216 Sep 198 Oct 225 Nov 270 Dec 315 Jan 2013 - QUESTION 2Dayang sells 5 kg bags of fertilizer to local farmers in Tg Karang. The sales data for the past 11 months is shown below. Month Demand (10s of bags) 1 4 2 6 3 4 4 5 5 10 6 8 7 7 8 9 9 12 10 14 11 15 1. Find the forecast for the month 12 using the methods below: a. Simple 4 month moving average (SMA) b.…arrow_forwardQuestion 1 Data:A drive-in restaurant is running a new promotion, the "Route 44," named after an interstatethat runs through their primary market area. The drink is promoted as 44 ounces of purecarbonated pleasure but the regional manager, being somewhat of a quality expert, wantsto make sure that the company's drink process can deliver 44 ounces. He decidesstatisticalquality control is the best way to monitor their process.For ten consecutive days he purchases five Route 44 drinks from franchise locations on hisway to headquarters and turns them over to the testing lab for volume analysis. The dataappear in the table, all amounts are in fluid ounces as measured by the testing lab.Drinks ← Sample Readings →Subgroup ↓ Drink 1 Drink 2 Drink 3 Drink 4 Drink 5 Mean RangeD 1 43.51 42.47 42.15 43.15 44.14A 2 42.94 44.90 42.72 43.68 43.71Y 3 42.05 44.65 45.37 42.43 45.32S 4 41.72 45.94 46.68 43.13 42.625 44.98 45.39 43.30 44.52 43.446 43.83 44.44 44.94 45.74 45.837 43.76 44.65 45.41 44.73…arrow_forwardDate is data of type: Nominal Ordinal Ratio Intervalarrow_forward
arrow_back_ios
SEE MORE QUESTIONS
arrow_forward_ios
Recommended textbooks for you
 Practical Management ScienceOperations ManagementISBN:9781337406659Author:WINSTON, Wayne L.Publisher:Cengage,
 Operations ManagementOperations ManagementISBN:9781259667473Author:William J StevensonPublisher:McGraw-Hill Education
 Operations and Supply Chain Management (Mcgraw-hi...Operations ManagementISBN:9781259666100Author:F. Robert Jacobs, Richard B ChasePublisher:McGraw-Hill Education
 Purchasing and Supply Chain ManagementOperations ManagementISBN:9781285869681Author:Robert M. Monczka, Robert B. Handfield, Larry C. Giunipero, James L. PattersonPublisher:Cengage Learning
 Production and Operations Analysis, Seventh Editi...Operations ManagementISBN:9781478623069Author:Steven Nahmias, Tava Lennon OlsenPublisher:Waveland Press, Inc.
Practical Management Science
Operations Management
ISBN:9781337406659
Author:WINSTON, Wayne L.
Publisher:Cengage,
Operations Management
Operations Management
ISBN:9781259667473
Author:William J Stevenson
Publisher:McGraw-Hill Education
Operations and Supply Chain Management (Mcgraw-hi...
Operations Management
ISBN:9781259666100
Author:F. Robert Jacobs, Richard B Chase
Publisher:McGraw-Hill Education
Purchasing and Supply Chain Management
Operations Management
ISBN:9781285869681
Author:Robert M. Monczka, Robert B. Handfield, Larry C. Giunipero, James L. Patterson
Publisher:Cengage Learning
Production and Operations Analysis, Seventh Editi...
Operations Management
ISBN:9781478623069
Author:Steven Nahmias, Tava Lennon Olsen
Publisher:Waveland Press, Inc.
Forecasting 2: Forecasting Types & Qualitative methods; Author: Adapala Academy & IES GS for Exams;https://www.youtube.com/watch?v=npWni9K6Z_g;License: Standard YouTube License, CC-BY
Introduction to Forecasting - with Examples; Author: Dr. Bharatendra Rai;https://www.youtube.com/watch?v=98K7AG32qv8;License: Standard Youtube License