
OPERATIONS MGMT - FIRST DAY
2018th Edition
ISBN: 9780135391242
Author: HEIZER
Publisher: PEARSON
expand_more
expand_more
format_list_bulleted
Concept explainers
Videos
Textbook Question
Chapter 4, Problem 33P
Question
••• 4.47 Storrs Cycles has just started selling the new Cyclone mountain bike, with monthly sales as shown in the table. First, co-owner Bob Day wants to
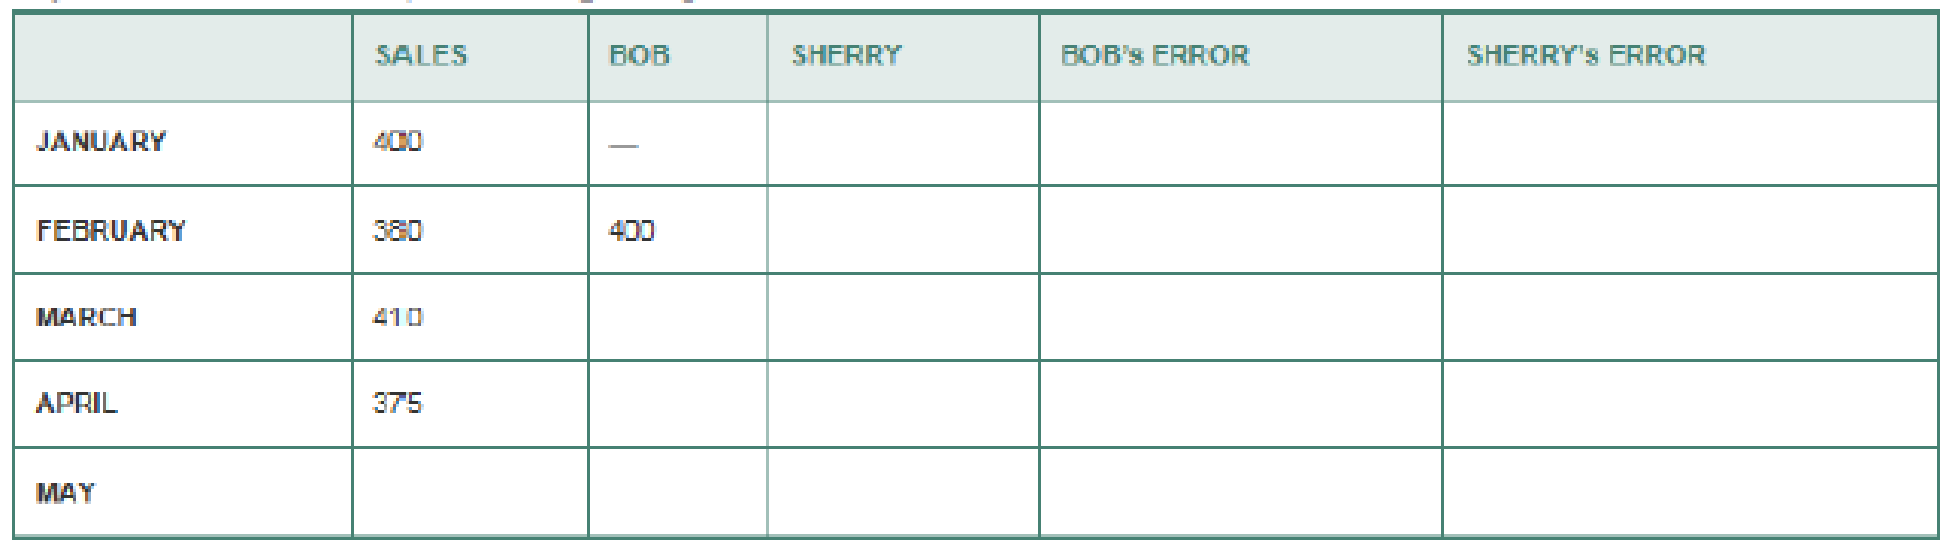
- a. Is there a strong linear trend in sales over time?
- b. Fill in the table with what Bob and Sherry each forecast for May and the earlier months, as relevant.
- c. Assume that May’s actual sales figure turns out to be 405. Complete the table’s columns and then calculate the mean absolute deviation for both Bob’s and Sherry’s methods.
- d. Based on these calculations, which method seems more accurate?
Expert Solution & Answer
Want to see the full answer?
Check out a sample textbook solution
Students have asked these similar questions
QUESTION 1 Sales of Fat Lips Burgers for 2012 are shown in the table below. 1. Do the 2 month SMA forecast 2. Do 2 month WMA forecast using the information below WMA – 2: last month, 1 – last 2 months 3. For the month of January 2012, the forecast was 438. Do the EMA forecast with the smoothing constant = 0.3. What is the forecast for Jan 2013? 4. Compare the forecasts above using MAD, MSE and MAPE. Which forecast method gives the least errors?
Month
Actual Sales
Forecast
Jan 2012
438
Feb
420
March
414
Apr
318
May
306
June
240
July
240
Aug
216
Sep
198
Oct
225
Nov
270
Dec
315
Jan 2013
-
QUESTION 2Dayang sells 5 kg bags of fertilizer to local farmers in Tg Karang. The sales data for the past 11 months is shown below.
Month
Demand (10s of bags)
1
4
2
6
3
4
4
5
5
10
6
8
7
7
8
9
9
12
10
14
11
15
1. Find the forecast for the month 12 using the methods below: a. Simple 4 month moving average (SMA) b.…
QUESTION ONE (b) The forecast of a product for the first week of January was 200 units, whereas the actual demand turned out to be 220 units.
i. Find the forecast for the week of January assuming the smoothing constant 0.2 α =
ii. Find the forecast for the third week of third week of January if the actual demand of the second week is 210 units
Question 16
Daily demand for sandwiches at a local deli is shown in the table. Using a 3 period weighted moving average (most recent demands receive the highest weights) with weights W1 = 0.50, W2 = 0.30 and W3 = 0.20, what is the forecast for day 8?
Group of answer choices
a. 39.3 sandwiches
b. 41.3 sandwiches
c. 43 sandwiches
d. 43.3 sandwiches
e. Impossible to determine
Chapter 4 Solutions
OPERATIONS MGMT - FIRST DAY
Ch. 4 - What is a qualitative foretasting model, and when...Ch. 4 - Identify and briefly describe the two general...Ch. 4 - Identify the three forecasting time horizons....Ch. 4 - Briefly describe the steps that are used to...Ch. 4 - A skeptical manager asks what medium-range...Ch. 4 - Explain why such forecasting devices as moving...Ch. 4 - What is the basic difference between a weighted...Ch. 4 - What three methods are used to determine the...Ch. 4 - Research and briefly describe the Delphi...Ch. 4 - What is the primary difference between a...
Ch. 4 - Define time series.Ch. 4 - What effect does the value of the smoothing...Ch. 4 - Explain the value of seasonal indices in...Ch. 4 - Which forecasting technique can place the most...Ch. 4 - In your own words, explain adaptive forecasting.Ch. 4 - What is the purpose of a tracking signal?Ch. 4 - Explain, in your own words, the meaning of the...Ch. 4 - What is the difference between a dependent and an...Ch. 4 - Give examples of industries that are affected by...Ch. 4 - Give examples of industries in which demand...Ch. 4 - Prob. 21DQCh. 4 - Prob. 22DQCh. 4 - The following gives the number of pints of type B...Ch. 4 - 4.2 a. Plot the above data on a graph. Do you...Ch. 4 - Refer to Problem 4.2. Develop a forecast for years...Ch. 4 - A check-processing center uses exponential...Ch. 4 - The Carbondale Hospital is considering the...Ch. 4 - The monthly sales for Yazici Batteries, Inc., were...Ch. 4 - The actual demand for the patients at Omaha...Ch. 4 - Daily high temperatures in St. Louis for the last...Ch. 4 - Lenovo uses the ZX-81 chip in some of its laptop...Ch. 4 - Data collected on the yearly registrations for a...Ch. 4 - Use exponential smoothing with a smoothing...Ch. 4 - Consider the following actual and forecast demand...Ch. 4 - As you can see in the following table, demand for...Ch. 4 - Following are two weekly forecasts made by two...Ch. 4 - Refer to Solved Problem 4.1 on page 138. a. Use a...Ch. 4 - Solved example 4.1 Sales of Volkswagens popular...Ch. 4 - Refer to Solved Problem 4.1. Using smoothing...Ch. 4 - Consider the following actual (At) and forecast...Ch. 4 - Income at the architectural firm Spraggins and...Ch. 4 - Question 4.20 Resolve Problem 4.19 with =.1 and ...Ch. 4 - Question 4.21 Refer to the trend-adjusted...Ch. 4 - Question 4.22 Refer to Problem 4.21. Complete the...Ch. 4 - Question 4.23 Sales of quilt covers at Bud Baniss...Ch. 4 - Question 4.25 The following gives the number of...Ch. 4 - Prob. 25PCh. 4 - Question 4.27 George Kyparisis owns a company...Ch. 4 - Question 4.28 Attendance at Orlandos newest...Ch. 4 - Question 4.29 North Dakota Electric Company...Ch. 4 - Question 4.33 The number of internal disk drives...Ch. 4 - Dr. Lillian Fok, a New Orleans psychologist,...Ch. 4 - Emergency calls to the 911 system of Durham, North...Ch. 4 - Using the 911 call data in Problem 4.43, forecast...Ch. 4 - Question 4.47 Storrs Cycles has just started...Ch. 4 - Question 4.49 Boulanger Savings and Loan is proud...Ch. 4 - Question 4.24 Mark Gershon, owner of a musical...Ch. 4 - Lori Cook has developed the following forecasting...Ch. 4 - Prob. 45PCh. 4 - Question 4.32 The following data relate the sales...Ch. 4 - Question 4.34 The number of auto accidents in...Ch. 4 - Question 4.35 Rhonda Clark, a Slippery Rock,...Ch. 4 - Accountants at the Tucson firm, Larry Youdelman,...Ch. 4 - Sales of tablet computers at Ted Glickmans...Ch. 4 - Question 4.38 City government has collected the...Ch. 4 - Using the data in Problem 4.39, apply linear...Ch. 4 - Bus and subway ridership for the summer months in...Ch. 4 - Thirteen students entered the business program at...Ch. 4 - Question 4.48 Dave Fletcher, the general manager...Ch. 4 - The following are monthly actual and forecast...Ch. 4 - Prob. 1CSCh. 4 - Prob. 2CSCh. 4 - Prob. 3CSCh. 4 - For its first 2 decades of existence, the NBAs...Ch. 4 - For its first 2 decades of existence, the NBAs...Ch. 4 - For its first 2 decades of existence, the NBAs...Ch. 4 - For its first 2 decades of existence, the NBAs...Ch. 4 - Forecasting at Hard Rock Cafe Video Case With the...Ch. 4 - Forecasting at Hard Rock Cafe Video Case With the...Ch. 4 - Forecasting at Hard Rock Cafe Video Case With the...Ch. 4 - Forecasting at Hard Rock Cafe Video Case With the...Ch. 4 - Forecasting at Hard Rock Cafe Video Case With the...
Knowledge Booster


Learn more about
Need a deep-dive on the concept behind this application? Look no further. Learn more about this topic, operations-management and related others by exploring similar questions and additional content below.Similar questions
- Question #2 Month Demand 1 45 2 48 3 43 4 48 5 49 6 54 7 47 8 50 9 46 10 47 Using the table above, calculate two forecasts using the following method:- First, for periods 4 through 10, develop the exponentially smoothed forecasts using a forecast for period 3 (F3) of 45.0 and an alpha of 0.4. ii. Calculate the weighted moving average for periods 4 through 10, using weights of .70, .20, and .10, with 0.70 applied to the most recent data. iii. Calculate the mean absolute deviation (MAD) for each forecasting procedure. Which forecasting procedure would you select? Why?arrow_forwardQuestion 2 i. Differentiate between independent and dependent variable in forecasting. ii. The last seven weeks of sales at KC car dealership can be seen in Table 2 below. Table 2 Week Sales 1 25 2 30 3 27 4 31 5 27 6 29 7 30 8 a. Use a three-period weighted-moving average forecast to determine a forecast for the 8th week using weights of 3, 2, and 1 (where the most recent week receives the highest weight). (Round all forecasts to the nearest whole unit.) b. Calculate the MAD for this forecast. c. What does the MAD indicate?arrow_forwardQUESTION 1The table below shows the sales figures for a brand of shoe over the last 12 months.Months SalesJanuary 69February 75March 86April 92May 95June 100July 108August 115September 125October 131November 140December 150 a. Using the following, forecast the sales for the months up to January the following year:-i. A simple three month moving averagearrow_forward
- Question Four: ABC Company sells home appliances. Daily sales for a six-day period were as follows: Day Sales Saturday 20 Sunday 24 Monday 30 Tuesday 40 Wednesday 36 Thursday 44 Forecast Friday sales volume using each of the following methods: A three-day moving average. A four day weighted average using weights of 0.1, 0.2, 0.3 and 0.4 Exponential smoothing with a smoothing constant equal to 0.2, assuming Wednesday forecast of 42. Determine a linear trend line equation for ABC Company. Use the trend equation to forecast Friday sales volume.arrow_forwardQuestion 2Chad and James are two veteran sales executives who have been working for a well-established car distributor selling new cars. About six years ago, believing that there were good prospects in starting a business in selling used cars, both gentlemen left their employment to venture out.Since the beginning of their company, sales had been quite positive, but the owners now wanted to know more about future sales using an appropriate forecasting method. For a start, they wanted to focus on the quarterly sales of a popular brand of used cars.The sales figures over the last five years were used for the forecast. They are presented in the table below. (c) Explain why forecasting, despite its usefulness or sophistication, should only be considered a useful tool for decision making in any business. What are other factors that need to be considered? (d) The business of selling cars in Singapore, like many businesses, is subject to uncertainties.Discuss three (3) external factors,…arrow_forwardQuestion 1. Question : (TCOs 6 and 8) What is the approximate forecast for July using a 40-month moving average if the historical demand is as follows: January is 35, February is 36, March is 40, April is 43, May is 48, and June is 49? 38 45 42 43 39 Question 4. Question : (TCO 8) Given an alpha factor of 0.4, a current demand for April of 5,500 units, and a March forecast of 4,900 units, calculate the May forecast. 4,000 6,050 5,080 4,520 5,140 Question 6. Question : (TCOs 5 and12) With a demand during lead time of 130, a safety stock of 20, and a container size of 30, how many kanbans (containers) would be needed? 6 5 8 10 16 Question 8. Question : (TCOs 6 and 8) In the process of using seasonal indices for forecasting, the first step that is taken is compute the average demand over all months. estimate next year’s total annual demand. divide the estimate of total annual demand by the number of seasons. find the average historical demand each…arrow_forward
- Question 2 Historical demand for gulab jamun from a sweet stall on Commercial Road is as displayed in the table. Month Demand (orders) January 66,753 February 67,686 March 68,641 April 68,979 May 69,278 June 69,577 July 69,602 August 70,348 September 70,806 October 71,011 November 71,819 December 72,752 What is the forecast for June using Holt's model with an alpha of 0.1 and a beta of 0.2? 69121 69612 70564 63545 Full explain this question text typingarrow_forwardQUESTION 1The table below shows the sales figures for a brand of shoe over the last 12 months.Months SalesJanuary 69February 75March 86April 92May 95June 100July 108August 115September 125October 131November 140December 150a. Using the following, forecast the sales for the months up to January the following year:-i. A simple three month moving average. ii. A three period weighted moving average using weights of 1, 2 and 3. Assign thehighest weight to the most recent data. iii. Exponential Smoothing when α= .6 and the forecast for March is 350.iv. Determine which of the three forecasting technique is the most accurate usingMAD. b. The following table shows the number of televisions sold over the last ten years at alocal electronic store.YEAR TV SALES1 1502 3003 4804 6005 6306 6407 7008 8259 90010 980i. Using trend projection, develop a formula to predict sales for years 11 and 12. Youhave to show all working. You will need to develop a table to calculate the slope andthe intercept.…arrow_forwardQuestion A reputable FMCG company is holding its Annual Sales Conference on January 30th 2021 for its New Year sales plan. The company is interested in launching new product beside its existing product lines. The new product will be novel in the history of the company. explain what FMCG company seeks for and following for above mentioned firm, with reason/limitations specified for the FMCG company. Discuss the techniques of forecasting that will be used by the company for its existing and new products. Explain specific type and reason for using those techniques. Also identify the limitations of these techniques. Use word/Excelarrow_forward
- Questions: 1. What are some of the potential benefits of a more formalized approach to forecasting? 2. Prepare a weekly forecast for the next four weeks for each product. Briefly explain why you chose the methods you used. (Hint for product 2, a simple approach, possibly some sort of naive/intuitive approach, would be preferable to a technical approach in view of the manager's disdain of more technical methods).arrow_forwardQUESTION 1 The table below shows the sales figures for a brand of shoe over the last 12 months. Months SalesJanuary 69February 75March 86April 92May 95June 100July 108August 115September 125October 131November 140December 150 a. Using the following, forecast the sales for the months up to January the following year:-i. A simple three month moving average. ii. A three period weighted moving average using weights of 1, 2 and 3. Assign thehighest weight to the most recent data. iii. Exponential Smoothing when α= .6 and the forecast for March is 350.iv. Determine which of the three forecasting technique is the most accurate using MADarrow_forwardQuestion 18 A tire company needs a forecast for studded tires in the next forecast period. The company typically uses an exponential smoothing forecast using a smoothing constant of alpha = 0.20. The demand for the most recent period was 100 and the forecast for the same period was 110. Based on this information, what is the tire company's forecast for the next period? Group of answer choices a. 100 tires b. 102 tires c. 108 tires d. 110 tires e. Impossible to determinearrow_forward
arrow_back_ios
SEE MORE QUESTIONS
arrow_forward_ios
Recommended textbooks for you
 Practical Management ScienceOperations ManagementISBN:9781337406659Author:WINSTON, Wayne L.Publisher:Cengage,
 Operations ManagementOperations ManagementISBN:9781259667473Author:William J StevensonPublisher:McGraw-Hill Education
 Operations and Supply Chain Management (Mcgraw-hi...Operations ManagementISBN:9781259666100Author:F. Robert Jacobs, Richard B ChasePublisher:McGraw-Hill Education
 Purchasing and Supply Chain ManagementOperations ManagementISBN:9781285869681Author:Robert M. Monczka, Robert B. Handfield, Larry C. Giunipero, James L. PattersonPublisher:Cengage Learning
 Production and Operations Analysis, Seventh Editi...Operations ManagementISBN:9781478623069Author:Steven Nahmias, Tava Lennon OlsenPublisher:Waveland Press, Inc.
Practical Management Science
Operations Management
ISBN:9781337406659
Author:WINSTON, Wayne L.
Publisher:Cengage,
Operations Management
Operations Management
ISBN:9781259667473
Author:William J Stevenson
Publisher:McGraw-Hill Education
Operations and Supply Chain Management (Mcgraw-hi...
Operations Management
ISBN:9781259666100
Author:F. Robert Jacobs, Richard B Chase
Publisher:McGraw-Hill Education
Purchasing and Supply Chain Management
Operations Management
ISBN:9781285869681
Author:Robert M. Monczka, Robert B. Handfield, Larry C. Giunipero, James L. Patterson
Publisher:Cengage Learning
Production and Operations Analysis, Seventh Editi...
Operations Management
ISBN:9781478623069
Author:Steven Nahmias, Tava Lennon Olsen
Publisher:Waveland Press, Inc.
Introduction to Forecasting; Author: Ekeeda;https://www.youtube.com/watch?v=5eIbVXrJL7k;License: Standard YouTube License, CC-BY