
Concept explainers
Videos
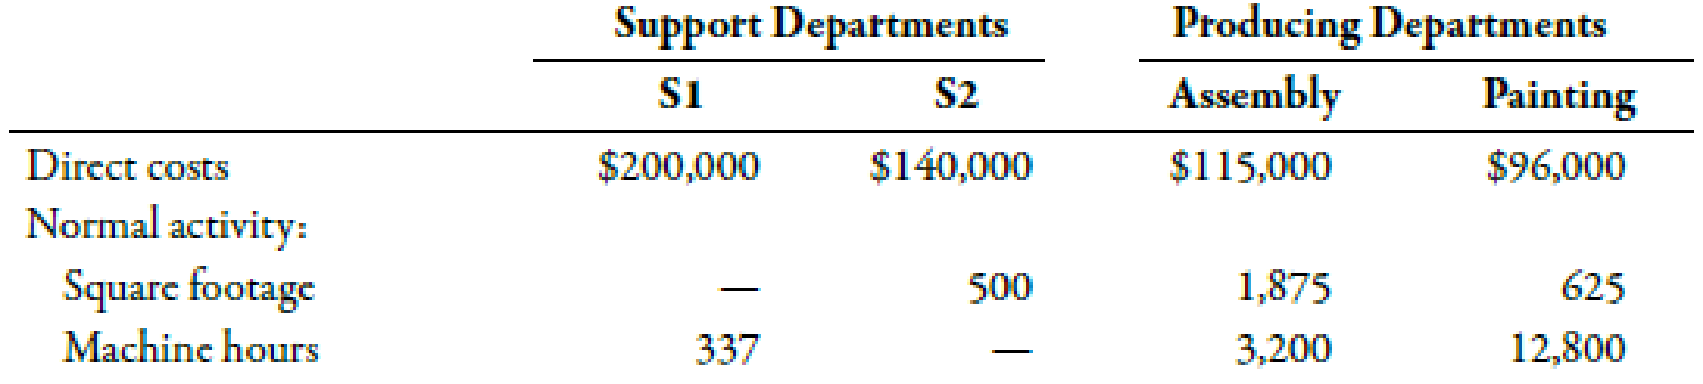
Use the following information for Brief Exercises 4-34 and 4-35:
Sanjay Company manufactures a product in a factory that has two producing departments, Assembly and Painting, and two support departments, S1 and S2. The activity driver for S1 is square footage, and the activity driver for S2 is number of machine hours. The following data pertain to Sanjay:
Brief Exercises 4-35 (Appendix 4B) Sequential Method
Refer to the information for Sanjay Company on the previous page. Now assume that Sanjay uses the sequential method to allocate support department costs. S1 is allocated first, then S2.
Required:
- 1. Calculate the cost assignment ratios to be used under the sequential method for S2, Assembly, and Painting. Carry out your answers to four decimal places.
- 2. Allocate the
overhead costs to the producing departments by using the sequential method.
1.
Computecost assignment ratios for S2 under sequential method.
Explanation of Solution
Sequential Method:
Sequential method recognizes that there is possible interaction between the support departments. However, it does notaccount for such interaction in full which makes it more accurate as compared to the direct method.
Use the following formula to calculatecost assignment ratios for S1 on the basis of number of square footage:
S2:
Substitute 500 for number of square footage in S2 and 3,000 for total square footage in the above formula.
Therefore, the cost assignment ratio for S2 is 0.1667.
Assembly department:
Substitute 1,875 for number ofsquare footage in assembly and 3,000 for total square footage in the above formula.
Therefore, the cost assignment ratio for assembly department is 0.6250.
Painting department:
Substitute 625 for number ofsquare footage in assembly and 3,000 for total square footage in the above formula.
Therefore, the cost assignment ratio for painting department is 0.2083.
Use the following formula to calculate cost assignment ratios for Department S2 on the basis of number of machine hours:
Assembly department:
Substitute 3,200 for number of machine hoursofassembly and 16,000 for total machine hours of producing department in the above formula.
Therefore, the assignment ratio for assembly department is 0.20.
Painting department:
Substitute 12,800 for number of machine hours of painting and 16,000 for total machine hours of producing department in the above formula.
Therefore, the assignment ratio for painting department is 0.80.
Working Note:
1.
Calculation of total number of square footage in producing departments:
2.
Calculation of total number of machine hoursof producing departments:
2.
Allocate the support department costs to the producing departments by using the sequential method:
Explanation of Solution
Allocation:
Allocation can be defined as the process of assigning the indirect costs to the cost object with the help of a convenient and reasonable method. It is essential to allocate indirect costs to the cost objects.
| Support departments | Producing departments | |||
| Allocate | S1($) | S2($) | Assembly($) | Painting($) |
| Direct costs | 200,000 | 140,000 | 115,000 | 96,000 |
| S1 | (200,000) | 33,340 | 125,000 | 41,660 |
| S2 | (173,340) | 34,668 | 138,672 | |
| Total | 0 | 0 | 274,668 | 276,332 |
Table (1)
Working Note:
1.
Allocation of support departments cost to S2:
For S1 cost:
2.
Allocation of support departments cost to assembly department:
For S1 cost:
For S2 cost:
3.
Allocation of support departments to painting department:
For S1 cost:
For S2 cost:
Want to see more full solutions like this?
Chapter 4 Solutions
CENGAGENOWV2 FOR HANSEN/MOWEN S CORNERS


- Use the following information for Brief Exercises 4-34 and 4-35: Sanjay Company manufactures a product in a factory that has two producing departments, Assembly and Painting, and two support departments, S1 and S2. The activity driver for S1 is square footage, and the activity driver for S2 is number of machine hours. The following data pertain to Sanjay: Brief Exercises 4-34 (Appendix 4B) Assigning Support Department Costs by Using the Direct Method Refer to the information for Sanjay Company above. Required: 1. Calculate the cost assignment ratios to be used under the direct method for Departments S1 and S2. (Note: Each support department will have two ratiosone for Assembly and the other for Painting.) 2. Allocate the support department costs to the producing departments by using the direct method.arrow_forwardUse the following information for Brief Exercises 4-27 and 4-28: Quillen Company manufactures a product in a factory that has two producing departments, Cutting and Sewing, and two support departments, S1 and S2. The activity driver for S1 is number of employees, and the activity driver for S2 is number of maintenance hours. The following data pertain to Quillen: Brief Exercises 4-27 (Appendix 4B) Assigning Support Department Costs by Using the Direct Method Refer to the information for Quillen Company above. Required: 1. Calculate the cost assignment ratios to be used under the direct method for Departments S1 and S2. (Note: Each support department will have two ratiosone for Cutting and the other for Sewing.) 2. Allocate the support department costs to the producing departments by using the direct method.arrow_forwardBienestar Inc., has the following departmental structure for producing a well-known multivitamin: A consultant designed the following cellular manufacturing structure for the same product: The times above the processes represent the time required to process one unit of product. Required: 1. Calculate the time required to produce a batch of 15 bottles using a batch-processing departmental structure. 2. Calculate the time to process 15 units using cellular manufacturing. 3. How much manufacturing time will the cellular manufacturing structure save for a batch of 15 units?arrow_forward
- Hercules Inc. manufactures elliptical exercise machines and treadmills. The products are produced in its Fabrication and Assembly production departments. In addition to production activities, several other activities are required to produce the two products. These activities and their associated activity rates are as follows: The activity-base usage quantities and units produced for each product were as follows: Use the activity rate and usage information to determine the total activity cost and activity cost per unit for each product.arrow_forwardUsing the same data found in Exercise 6.22, assume the company uses the FIFO method. Required: Prepare a schedule of equivalent units, and compute the unit cost for the month of December. Fordman Company has a product that passes through two processes: Grinding and Polishing. During December, the Grinding Department transferred 20,000 units to the Polishing Department. The cost of the units transferred into the second department was 40,000. Direct materials are added uniformly in the second process. Units are measured the same way in both departments. The second department (Polishing) had the following physical flow schedule for December: Costs in beginning work in process for the Polishing Department were direct materials, 5,000; conversion costs, 6,000; and transferred in, 8,000. Costs added during the month: direct materials, 32,000; conversion costs, 50,000; and transferred in, 40,000.arrow_forwardLacy, Inc., produces a subassembly used in the production of hydraulic cylinders. The subassemblies are produced in three departments: Plate Cutting, Rod Cutting, and Welding. Materials are added at the beginning of the process. Overhead is applied using the following drivers and activity rates: Other data for the Plate Cutting Department are as follows: Required: 1. Prepare a physical flow schedule. 2. Calculate equivalent units of production for: a. Direct materials b. Conversion costs 3. Calculate unit costs for: a. Direct materials b. Conversion costs c. Total manufacturing 4. Provide the following information: a. The total cost of units transferred out b. The journal entry for transferring costs from Plate Cutting to Welding c. The cost assigned to units in ending inventoryarrow_forward
- Activity-based product costing Sweet Sugar Company manufactures three products (white sugar, brown sugar, and powdered sugar) in a continuous production process. Senior management has asked the controller to conduct an activity-based costing study. The controller identified the amount of factory overhead required by the critical activities of the organization as follows: The activity bases identified for each activity are as follows: The activity-base usage quantities and units produced for the three products were determined from corporate records and are as follows: Each product requires 0.5 machine hour per unit. Instructions Determine the activity rate for each activity. Determine the total and per-unit activity cost for all three products. Round to nearest cent. Why arent the activity unit costs equal across all three products since they require the same machine time per unit?arrow_forwardBig Mikes, a large hardware store, has gathered data on its overhead activities and associated costs for the past 10 months. Nizam Sanjay, a member of the controllers department, believes that overhead activities and costs should be classified into groups that have the same driver. He has decided that unloading incoming goods, counting goods, and inspecting goods can be grouped together as a more general receiving activity, since these three activities are all driven by the number of receiving orders. The 10 months of data shown below have been gathered for the receiving activity. Required: 1. Prepare a scattergraph, plotting the receiving costs against the number of purchase orders. Use the vertical axis for costs and the horizontal axis for orders. 2. Select two points that make the best fit, and compute a cost formula for receiving costs. 3. Using the high-low method, prepare a cost formula for the receiving activity. 4. Using the method of least squares, prepare a cost formula for the receiving activity. What is the coefficient of determination?arrow_forwardA company manufactures a liquid product called Crystal. The basic ingredients are put into process in Department 1. In Department 2, other materials are added that increase the number of units being processed by 50%. The factory has only two departments. Calculate the following for each department: (a) unit cost for the month for materials, labor, and factory overhead, (b) cost of the units transferred, and (c) cost of the ending work in process.arrow_forward
- Use the following information for Exercises 5-44 through 5-46: The following six situations at Diviney Manufacturing Inc. are independent. a. A manual insertion process takes 30 minutes and 8 pounds of material to produce a product. Automating the insertion process requires 15 minutes of machine time and 7.5 pounds of material. The cost per labor hour is 12, the cost per machine hour is 8, and the cost per pound of materials is 10. b. With its original design, a gear requires 8 hours of setup time. By redesigning the gear so that the number of different grooves needed is reduced by 50%, the setup time is reduced by 75%. The cost per setup hour is 50. c. A product currently requires 6 moves. By redesigning the manufacturing layout, the number of moves can be reduced from 6 to 0. The cost per move is 20. d. Inspection time for a plant is 16,000 hours per year. The cost of inspection consists of salaries of 8 inspectors, totaling 320,000. Inspection also uses supplies costing 5 per inspection hour. The company eliminated most defective components by eliminating low-quality suppliers. The number of production errors was reduced dramatically by installing a system of statistical process control. Further quality improvements were realized by redesigning the products, making them easier to manufacture. The net effect was to achieve a close to zero-defect state and eliminate the need for any inspection activity. e. Each unit of a product requires 6 components. The average number of components is 6.5 due to component failure, requiring rework and extra components. Developing relations with the right suppliers and increasing the quality of the purchased component can reduce the average number of components to 6 components per unit. The cost per component is 500. f. A plant produces 100 different electronic products. Each product requires an average of 8 components that are purchased externally. The components are different for each part. By redesigning the products, it is possible to produce the 100 products so that they all have 4 components in common. This will reduce the demand for purchasing, receiving, and paying bills. Estimated savings from the reduced demand are 900,000 per year. 5-44 Nonvalue-Added Costs Refer to the information for Diviney Manufacturing on the previous page. Required: Estimate the nonvalue-added cost for each situation.arrow_forwardThe controller of the South Charleston plant of Ravinia, Inc., monitored activities associated with materials handling costs. The high and low levels of resource usage occurred in September and March for three different resources associated with materials handling. The number of moves is the driver. The total costs of the three resources and the activity output, as measured by moves for the two different levels, are presented as follows: Required: 1. Determine the cost behavior formula of each resource. Use the high-low method to assess the fixed and variable components. 2. Using your knowledge of cost behavior, predict the cost of each item for an activity output level of 9,000 moves. 3. Construct a cost formula that can be used to predict the total cost of the three resources combined. Using this formula, predict the total materials handling cost if activity output is 9,000 moves. In general, when can cost formulas be combined to form a single cost formula?arrow_forwardThe management of Wheeler Company has decided to develop cost formulas for its major overhead activities. Wheeler uses a highly automated manufacturing process, and power costs are a significant manufacturing cost. Cost analysts have decided that power costs are mixed; thus, they must be broken into their fixed and variable elements so that the cost behavior of the power usage activity can be properly described. Machine hours have been selected as the activity driver for power costs. The following data for the past eight quarters have been collected: Required: 1. Prepare a scattergraph by plotting power costs against machine hours. Does the scatter-graph show a linear relationship between machine hours and power cost? 2. Using the high and low points, compute a power cost formula. 3. Use the method of least squares to compute a power cost formula. Evaluate the coefficient of determination. 4. Rerun the regression and drop the point (20,000; 26,000) as an outlier. Compare the results from this regression to those for the regression in Requirement 3. Which is better?arrow_forward
 Managerial Accounting: The Cornerstone of Busines...AccountingISBN:9781337115773Author:Maryanne M. Mowen, Don R. Hansen, Dan L. HeitgerPublisher:Cengage Learning
 Managerial AccountingAccountingISBN:9781337912020Author:Carl Warren, Ph.d. Cma William B. TaylerPublisher:South-Western College Pub
 Financial And Managerial AccountingAccountingISBN:9781337902663Author:WARREN, Carl S.Publisher:Cengage Learning,
 Cornerstones of Cost Management (Cornerstones Ser...AccountingISBN:9781305970663Author:Don R. Hansen, Maryanne M. MowenPublisher:Cengage Learning
 Principles of Cost AccountingAccountingISBN:9781305087408Author:Edward J. Vanderbeck, Maria R. MitchellPublisher:Cengage Learning
 Excel Applications for Accounting PrinciplesAccountingISBN:9781111581565Author:Gaylord N. SmithPublisher:Cengage Learning