What are the variables in each graph? Describe how the variables are related at various points on the graph.
To define the variables in given graph and describe the relation of variables at various points on the graph.
Answer to Problem 2P
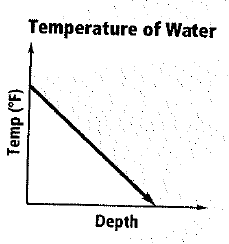
Variables are depth and temperature.
As the depth increases the temperature decreases.
Explanation of Solution
Given information: A graph:
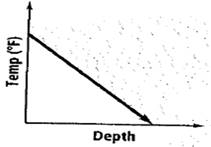
The horizontal axis is labeled as Depth. So the independent variable is Depth.
The vertical axis is labeled as Temperature. So the dependent variable is Temperature.
Therefore, given graph is showing variables of Depth and Temperature.
Shown graph has a straight line. The temperature is decreasing at a constant rate.
From the graph we can see that as the depth increase, the temperature decease.
Chapter 4 Solutions
High School Math 2012 Common-core Algebra 1 Practice And Problem Solvingworkbook Grade 8/9
Additional Math Textbook Solutions
Elementary and Intermediate Algebra: Concepts and Applications (7th Edition)
College Algebra
Linear Algebra with Applications (2-Download)
College Algebra in Context with Applications for the Managerial, Life, and Social Sciences (5th Edition)
Elementary Algebra
A Graphical Approach to College Algebra (6th Edition)

 Algebra and Trigonometry (6th Edition)AlgebraISBN:9780134463216Author:Robert F. BlitzerPublisher:PEARSON
 Contemporary Abstract AlgebraAlgebraISBN:9781305657960Author:Joseph GallianPublisher:Cengage Learning
 Linear Algebra: A Modern IntroductionAlgebraISBN:9781285463247Author:David PoolePublisher:Cengage Learning
 Algebra And Trigonometry (11th Edition)AlgebraISBN:9780135163078Author:Michael SullivanPublisher:PEARSON
 Introduction to Linear Algebra, Fifth EditionAlgebraISBN:9780980232776Author:Gilbert StrangPublisher:Wellesley-Cambridge Press
 College Algebra (Collegiate Math)AlgebraISBN:9780077836344Author:Julie Miller, Donna GerkenPublisher:McGraw-Hill Education