Concept explainers
Videos
Graph each function rule.
To plot: the function
Explanation of Solution
Given:
The function is
Calculation:
Steps to plot the function:
Step1
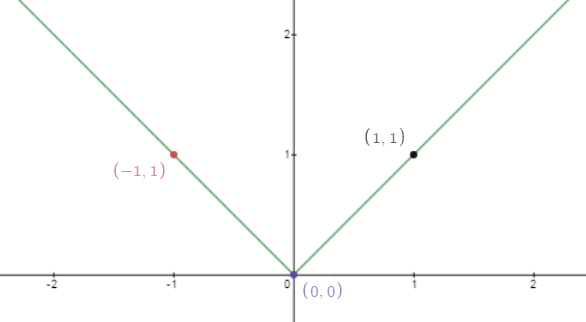
First determine the plot of
The values of y will always positive whatever the values of x negative or positive. Consider any of the values of x and determine the values of y for the coordinates.
For x = 0,
For x = 1,
For x = -1,
Thus, the plot of function
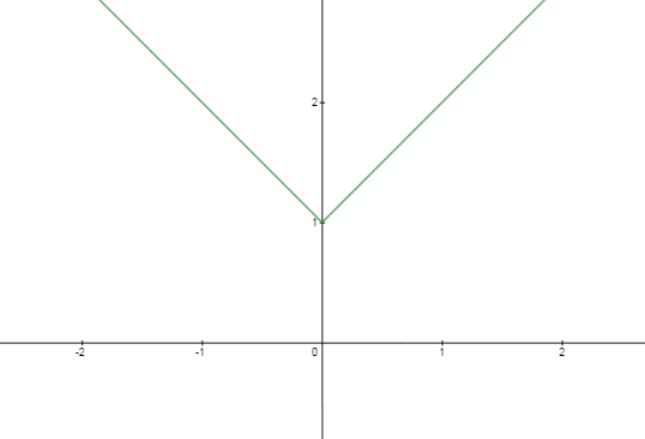
Step2
Shift the same plot in y direction by value 1. Thus, the plot of function
Chapter 4 Solutions
High School Math 2012 Common-core Algebra 1 Practice And Problem Solvingworkbook Grade 8/9
Additional Math Textbook Solutions
Elementary Algebra
Algebra and Trigonometry
College Algebra (7th Edition)
Linear Algebra with Applications (9th Edition) (Featured Titles for Linear Algebra (Introductory))
Intermediate Algebra (7th Edition)
College Algebra in Context with Applications for the Managerial, Life, and Social Sciences (5th Edition)


 Algebra and Trigonometry (6th Edition)AlgebraISBN:9780134463216Author:Robert F. BlitzerPublisher:PEARSON
 Contemporary Abstract AlgebraAlgebraISBN:9781305657960Author:Joseph GallianPublisher:Cengage Learning
 Linear Algebra: A Modern IntroductionAlgebraISBN:9781285463247Author:David PoolePublisher:Cengage Learning
 Algebra And Trigonometry (11th Edition)AlgebraISBN:9780135163078Author:Michael SullivanPublisher:PEARSON
 Introduction to Linear Algebra, Fifth EditionAlgebraISBN:9780980232776Author:Gilbert StrangPublisher:Wellesley-Cambridge Press
 College Algebra (Collegiate Math)AlgebraISBN:9780077836344Author:Julie Miller, Donna GerkenPublisher:McGraw-Hill Education