What are the variables in each graph? Describe how the variables are related at various points on the graph.
To give: The variables in the graph and to describe the relation between them.
Explanation of Solution
Given information:
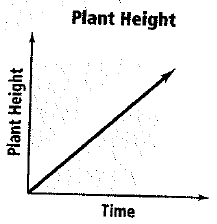
The given graph is as follows
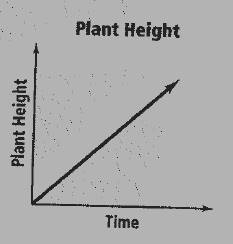
From the given graph, the variables are time and plant height.
As the time increases the plant height also increase. The slope of the graph is constant.
So, the given graph is linear.
Hence, the there is a linear relation between the time and plant height.
Chapter 4 Solutions
High School Math 2012 Common-core Algebra 1 Practice And Problem Solvingworkbook Grade 8/9
Additional Math Textbook Solutions
A Graphical Approach to College Algebra (6th Edition)
College Algebra (6th Edition)
College Algebra with Modeling & Visualization (6th Edition)
College Algebra (7th Edition)
Algebra and Trigonometry
Graphical Approach To College Algebra

 Algebra and Trigonometry (6th Edition)AlgebraISBN:9780134463216Author:Robert F. BlitzerPublisher:PEARSON
 Contemporary Abstract AlgebraAlgebraISBN:9781305657960Author:Joseph GallianPublisher:Cengage Learning
 Linear Algebra: A Modern IntroductionAlgebraISBN:9781285463247Author:David PoolePublisher:Cengage Learning
 Algebra And Trigonometry (11th Edition)AlgebraISBN:9780135163078Author:Michael SullivanPublisher:PEARSON
 Introduction to Linear Algebra, Fifth EditionAlgebraISBN:9780980232776Author:Gilbert StrangPublisher:Wellesley-Cambridge Press
 College Algebra (Collegiate Math)AlgebraISBN:9780077836344Author:Julie Miller, Donna GerkenPublisher:McGraw-Hill Education