Concept explainers
Videos
Graph each function rule.
To plot: the function
Explanation of Solution
Given:
The function is
Calculation:
Steps to plot the function:
Step1
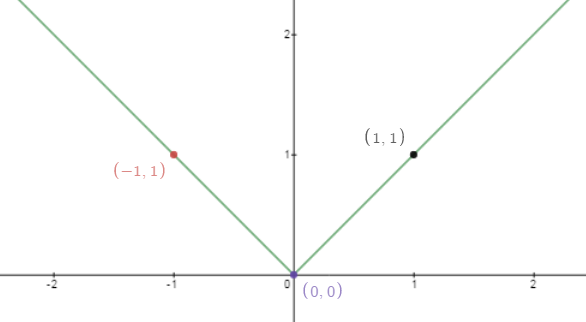
First determine the plot of
The values of y will always positive whatever the values of x negative or positive. Consider any of the values of x and determine the values of y for the coordinates.
For x = 0,
For x = 1,
For x = -1,
Thus, the plot of function
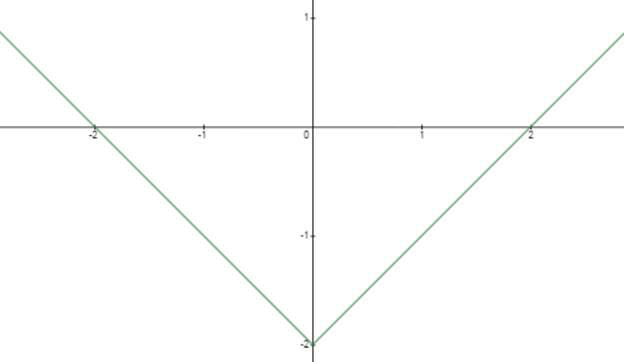
Step2
Shift the same plot in negative y direction by value 2. Thus, the plot of function
Chapter 4 Solutions
High School Math 2012 Common-core Algebra 1 Practice And Problem Solvingworkbook Grade 8/9
Additional Math Textbook Solutions
College Algebra in Context with Applications for the Managerial, Life, and Social Sciences (5th Edition)
Introductory and Intermediate Algebra for College Students (5th Edition)
Elementary Algebra: Concepts and Applications (10th Edition)
College Algebra (7th Edition)
Algebra and Trigonometry
Elementary Algebra


 Algebra and Trigonometry (6th Edition)AlgebraISBN:9780134463216Author:Robert F. BlitzerPublisher:PEARSON
 Contemporary Abstract AlgebraAlgebraISBN:9781305657960Author:Joseph GallianPublisher:Cengage Learning
 Linear Algebra: A Modern IntroductionAlgebraISBN:9781285463247Author:David PoolePublisher:Cengage Learning
 Algebra And Trigonometry (11th Edition)AlgebraISBN:9780135163078Author:Michael SullivanPublisher:PEARSON
 Introduction to Linear Algebra, Fifth EditionAlgebraISBN:9780980232776Author:Gilbert StrangPublisher:Wellesley-Cambridge Press
 College Algebra (Collegiate Math)AlgebraISBN:9780077836344Author:Julie Miller, Donna GerkenPublisher:McGraw-Hill Education