
Connect Hosted by ALEKS Online Access for Elementary Statistics
3rd Edition
ISBN: 9781260373769
Author: William Navidi
Publisher: MCGRAW-HILL HIGHER EDUCATION
expand_more
expand_more
format_list_bulleted
Concept explainers
Videos
Textbook Question
Chapter 4.1, Problem 36E
Mortgage payments: The following table presents monthly interest rates, in percent, for 30-year and 15-year fixed-rate mortgages, for a recent year.
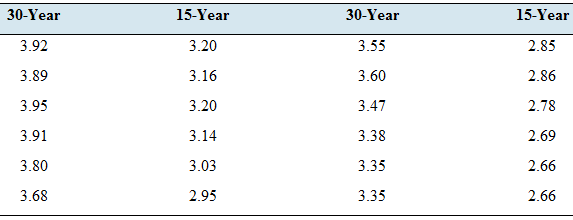
- Construct a
scatterplot of the 15-year rate (y) versus the 30-year rate (x). - Compute the
correlation coefficient between 30-year and 15-year rates. - When the 30-year rate is below average, would you expect the 15-year rate to be above or below average? Explain.
- Which of the following is the best interpretation of the correlation coefficient?
- When a bank increases the 30-year rate: that causes the 15-year rate to rise as well.
- Interest rates are determined by economic conditions. economic conditions cause 30-year rates to these same conditions cause 15 -year rates to increase as well.
- When a bank increases the 15-year rate, that causes the 30-year rate to rise as well.
Expert Solution & Answer
Want to see the full answer?
Check out a sample textbook solution
Students have asked these similar questions
The table below reports the annual stock price in September for Apple from 2005 to 2014. Develop a simple index for the change in
earning per share over the period. Use 2005 as the base period.
percentages (e.g. 131.32 instead of 1.31))
(Indexes should be rounded to 2 decimal places and be in
Year
Earnings Per Share ($)
Simple Index
2005
4.32
2006
4.14
2007
4.86
2008
5.94
2009
6.76
2010
10.08
2011
16.51
2012
23.65
2013
26.21
2014
29.86
Click here for the Excel Data File, Data file should open in a new browswer window. Select "File" then "Save As" to download the file to
your computer and be able to use it in Excel.
a. By what percent have stock prices changed from 2005 to 2009?
b. By what percent have stock prices changed from 2005 to 2014?
c. By what percent have stock prices changed from 2009 to 2014?
c. Predict sales in 15 years.
If You have this information about return of stock in 3 periods:
-12%, 20% and 25%.
calculate:
The arithmetic average.
The geometric average.
Chapter 4 Solutions
Connect Hosted by ALEKS Online Access for Elementary Statistics
Ch. 4.1 - In Exercises 9-12, fill in each blank with the...Ch. 4.1 - In Exercises 9-12, fill in each blank with the...Ch. 4.1 - In Exercises 9-12, fill in each blank with the...Ch. 4.1 - In Exercises 9-12, fill in each blank with the...Ch. 4.1 - Prob. 13ECh. 4.1 - Prob. 14ECh. 4.1 - In Exercises 13-16, determine whether the...Ch. 4.1 - In Exercises 13-16, determine whether the...Ch. 4.1 - In Exercises 17-20, compute the correlation...Ch. 4.1 - In Exercises 17-20, compute the correlation...
Ch. 4.1 - In Exercises 17-20, compute the correlation...Ch. 4.1 - In Exercises 17-20, compute the correlation...Ch. 4.1 - In Exercises 21-24, determine whether the...Ch. 4.1 - In Exercises 21-24, determine whether the...Ch. 4.1 - In Exercises 21-24, determine whether the...Ch. 4.1 - In Exercises 21-24, determine whether the...Ch. 4.1 - In Exercises 25-30, determine whether the...Ch. 4.1 - In Exercises 25-30, determine whether the...Ch. 4.1 - In Exercises 25-30, determine whether the...Ch. 4.1 - In Exercises 25-30, determine whether the...Ch. 4.1 - In Exercises 25-30, determine whether the...Ch. 4.1 - In Exercises 25-30, determine whether the...Ch. 4.1 - Price of eggs and milk: The following table...Ch. 4.1 - Government funding: The following table presents...Ch. 4.1 - Pass the ball: The following table lists the...Ch. 4.1 - Carbon footprint: Carbon dioxide (CO2) is produced...Ch. 4.1 - Foot temperatures: Foot ulcers are a common...Ch. 4.1 - Mortgage payments: The following table presents...Ch. 4.1 - Blood pressure: A blood pressure measurement...Ch. 4.1 - Prob. 38ECh. 4.1 - Police and crime: In a survey of cities in the...Ch. 4.1 - Age and education: A survey of U.S. adults showed...Ch. 4.1 - Whats the correlation? In a sample of adults, the...Ch. 4.1 - Prob. 42ECh. 4.1 - Changing means and standard deviations: A small...Ch. 4.2 - In Exercises 5-7, fill in each blank with the...Ch. 4.2 - In Exercises 5-7, fill in each blank with the...Ch. 4.2 - In Exercises 5-7, fill in each blank with the...Ch. 4.2 - Prob. 8ECh. 4.2 - Prob. 9ECh. 4.2 - Prob. 10ECh. 4.2 - Prob. 11ECh. 4.2 - Prob. 12ECh. 4.2 - In Exercises 13-16, compute the least-squares...Ch. 4.2 - In Exercises 13-16, compute the least-squares...Ch. 4.2 - In Exercises 13-16, compute the least-squares...Ch. 4.2 - In Exercises 13-16, compute the least-squares...Ch. 4.2 - Compute the least-squares regression he for...Ch. 4.2 - Compute the least-squares regression he for...Ch. 4.2 - In a hypothetical study of the relationship...Ch. 4.2 - Assume in a study of educational level in years...Ch. 4.2 - Price of eggs and milk: The following table...Ch. 4.2 - Government funding: The following table presents...Ch. 4.2 - Pass the ball: The following table lists the...Ch. 4.2 - Carbon footprint: Carbon dioxide (CO2) is produced...Ch. 4.2 - Foot temperatures: Foot ulcers are a common...Ch. 4.2 - Mortgage payments: The following table presents...Ch. 4.2 - Blood pressure: A blood pressure measurement...Ch. 4.2 - Butterfly wings: Do larger butterflies live...Ch. 4.2 - Interpreting technology: The following display...Ch. 4.2 - Interpreting technology: The following display...Ch. 4.2 - Interpreting technology: The following MINITAB...Ch. 4.2 - Interpreting technology: The following MINITAB...Ch. 4.2 - Prob. 33ECh. 4.2 - Prob. 34ECh. 4.2 - Least-squares regression line for z-scores: The...Ch. 4.3 - In Exercises 5-10, fill in each blank with the...Ch. 4.3 - In Exercises 5-10, fill in each blank with the...Ch. 4.3 - In Exercises 5-10, fill in each blank with the...Ch. 4.3 - In Exercises 5-10, fill in each blank with the...Ch. 4.3 - In Exercises 5-10, fill in each blank with the...Ch. 4.3 - Prob. 10ECh. 4.3 - Prob. 11ECh. 4.3 - In Exercises 11-14, determine whether the...Ch. 4.3 - Prob. 13ECh. 4.3 - In Exercises 11-14, determine whether the...Ch. 4.3 - For the following data set: Compute the...Ch. 4.3 - For the following data set: Compute the...Ch. 4.3 - For the following data set: Compute the...Ch. 4.3 - For the following data set: Compute the...Ch. 4.3 - Prob. 19ECh. 4.3 - Prob. 20ECh. 4.3 - Prob. 21ECh. 4.3 - Prob. 22ECh. 4.3 - Hot enough for you? The following table presents...Ch. 4.3 - Presidents and first ladies: The presents the ages...Ch. 4.3 - Mutant genes: In a study to determine whether the...Ch. 4.3 - Imports and exports: The following table presents...Ch. 4.3 - Energy consumption: The following table presents...Ch. 4.3 - Cost of health care: The following table presents...Ch. 4.3 - Prob. 29ECh. 4.3 - Prob. 30ECh. 4.3 - Prob. 31ECh. 4.3 - Transforming a variable: The following table...Ch. 4.3 - Prob. 33ECh. 4.3 - Prob. 34ECh. 4 - Compute the correlation coefficient for the...Ch. 4 - The number of theaters showing the movie Monsters...Ch. 4 - Use the data in Exercise 2 to compute the...Ch. 4 - A scatterplot has a correlation of r=1. Describe...Ch. 4 - Prob. 5CQCh. 4 - Prob. 6CQCh. 4 - Use the least-squares regression line computed in...Ch. 4 - Use the least-squares regression line computed in...Ch. 4 - Prob. 9CQCh. 4 - A scatterplot has a least-squares regression line...Ch. 4 - Prob. 11CQCh. 4 - Prob. 12CQCh. 4 - A sample of students was studied to determine the...Ch. 4 - In a scatter-plot; the point (-2, 7) is...Ch. 4 - The correlation coefficient for a data set is...Ch. 4 - Prob. 1RECh. 4 - Prob. 2RECh. 4 - Hows your mileage? Weight (in tons) and fuel...Ch. 4 - Prob. 4RECh. 4 - Energy efficiency: A sample of 10 households was...Ch. 4 - Energy efficiency: Using the data in Exercise 5:...Ch. 4 - Prob. 7RECh. 4 - Prob. 8RECh. 4 - Prob. 9RECh. 4 - Prob. 10RECh. 4 - Baby weights: The average gestational age (time...Ch. 4 - Commute times: Every morning, Tania leaves for...Ch. 4 - Prob. 13RECh. 4 - Prob. 14RECh. 4 - Prob. 15RECh. 4 - Describe an example which two variables are...Ch. 4 - Two variables x and y have a positive association...Ch. 4 - Prob. 3WAICh. 4 - Prob. 4WAICh. 4 - Prob. 5WAICh. 4 - Prob. 6WAICh. 4 - Prob. 7WAICh. 4 - Prob. 8WAICh. 4 - Prob. 9WAICh. 4 - The following table, reproduced from the chapter...Ch. 4 - Prob. 2CSCh. 4 - Prob. 3CSCh. 4 - Prob. 4CSCh. 4 - Prob. 5CSCh. 4 - Prob. 6CSCh. 4 - Prob. 7CSCh. 4 - Prob. 8CSCh. 4 - Prob. 9CSCh. 4 - Prob. 10CSCh. 4 - Prob. 11CSCh. 4 - Prob. 12CSCh. 4 - Prob. 13CSCh. 4 - If we are going to use data from this year to...Ch. 4 - Prob. 15CS
Knowledge Booster


Learn more about
Need a deep-dive on the concept behind this application? Look no further. Learn more about this topic, statistics and related others by exploring similar questions and additional content below.Similar questions
- Table 6 shows the year and the number ofpeople unemployed in a particular city for several years. Determine whether the trend appears linear. If so, and assuming the trend continues, in what year will the number of unemployed reach 5 people?arrow_forwardThe US. import of wine (in hectoliters) for several years is given in Table 5. Determine whether the trend appearslinear. Ifso, and assuming the trend continues, in what year will imports exceed 12,000 hectoliters?arrow_forwardGo to Yahoo!Finance and download data at the MONTHLY frequency for the stock Apple Inc. with ticker AAPL with starting date January 1, 1990 and end date August 4, 2016. Use the ADJUSTED CLOSING PRICE to create the monthly RETURNS that are the percentage change of the adjusted closing price (NB: make sure to sort first the price from OLDEST TO NEWEST; the percentage return is 100 times the price change between the current and previous month divided by the price in the previous month). Based on the time series of the stock return, answer the following questions (NB: you should have 319 monthly returns): Calculate the sample mean or average of the stock return: Calculate the sample standard deviation of the stock return: !!! For the questions below, use the values for the mean and std. dev. that you typed above (only the first 2 decimals)!!! Assuming that the returns follow a normal distribution: Calculate the P(return > 2.21): Calculate the P(-12.37 x) = 0.9704: Calculate the lower…arrow_forward
- A five-year project requires an investment of -112 and has the following cash flows in years 1 through 5, respectively (all cash flows in dollars): 48, 88, 34, 15, and 52. Find the difference between the Cauchy upper bound and the Cauchy lower bound. Write your answer as a percentage with two decimals; e.g., 23.55% but do not write the % sign. (Acceptable error = 0.50%)arrow_forwardThe following graph shows the average annual prime rate of interest (to the nearest whole percent) charged by banks for each of the years from 2000 to 2009. Average Annual Prime Rate of Interest 10 9. 8 4 3. 2 1 "00 '01 '02 '03 '04 "05 "06 '07 "08 '09 Year a. In which year was the prime rate the lowest, and what was the rate? The prime rate was lowest in with the rate of %. b. In 2002, did the prime rate increase or decrease, and how much was the increase or decrease? In 2002, the prime rate (select) by %. Prime Rate (%)arrow_forwardState the formula for the Present Value of a Continuous Stream of Income.arrow_forward
- if changing market condition cause a company earning 8000000 in 2005 to project a loss of 2 percent of its profit in each of the next 5 year ,what profit does in project in 2010arrow_forwardComplete the following table and draw a graph showing how bond price for each bond changes over time as they move towards their maturity dates. Describe the relationship between bond prices and time remaining for maturity. Using the table below show all the calculations for every bond prices calculated Years remaining to maturity BOND A Coupon rate = 8% p.a. Market interest rate = 6% p.a. BOND B Coupon rate = 6% p.a. Market interest rate = 6% p.a. BOND C Coupon rate = 4% p.a. Market interest rate = 6% p.a. 10 9 8 7 6 5 4 3 2 1 0arrow_forwardpart 3arrow_forward
- The Bank of Canada is interested in studying the relationship between mortgage rates and median home prices. The data is provided below interest rate (%) 10.30 Year Median home price S183,800 $183,200 1988 1989 10.30 1990 10.10 $174,900 1991 9.30 S173,500 $172,900 $173,200 1992 8.40 1993 7.30 1994 8.40 $173,200 S169,700 S174,500 1995 7.90 1996 7.60 1997 7.60 $177,900 $188,100 S203,200 $230,200 $258,200 S309,800 1998 6.90 1999 7.40 2000 8.10 2001 7.00 2002 6.50 2003 5.80 $329,800 2004 5.80 $431,000 2005 2006 2007 $515,000 $537,000 $496,000 5.80 6.40 6.30 2008 6.00 $352,000 $232,000 $291,700 $262,900 2009 5.00 2010 4.70 2011 4.40 2012 2013 3.60 $299,200 4.00 $321,200 $373,500 $358,100 $382,500 $402,900 2014 4.10 2015 3.80 2016 3.60 2017 4.00 a) Estimate a simple linear regression model and find the value of the parameters for the estimation of mortgage rates and the median home price. b) Interpret the intercept and the slope coefficients c) State the correlation coefficient and the…arrow_forward21:40 ll LTE A brainmass.com Sign in Join Forecast E Add The Mayfair Department Store in Davenport, lowa, is trying to determine the amount of sales lost while it was shut down during July and August because of damage caused by the Mississippi River flood. Sales data for January through June follow. Month Sales ($1000s) January 185.72 February 167.84 March 205.11 April 210.36 May 255.57 June 261.19 a) Use exponential smoothing with Alpha = 0.4, to develop a forecast for July and August. (Hint: Use the forecast for July as the actual sales in July in developing the August forecast.) Comment on the use of exponential smoothing for forecasts more than one period into the future. We use cookies to ensure that we give you the best experience on our website. By continuing to use the site, you consent to the use of cookies. Please review our Privacy Policy OKarrow_forward1. A stock has had the following year-end prices and dividends: Price ($) Dividend ($) Year 1 2 3 st 5 6 91.79 93 94.74 94.48 96.72 96.63 1.34 1.42 1.71 1.44 1.74 What is the geometric average return for the stock? Answer as a percentage to two decimals (if you get -0.0435, you should answer-4.35).arrow_forward
arrow_back_ios
SEE MORE QUESTIONS
arrow_forward_ios
Recommended textbooks for you

 College AlgebraAlgebraISBN:9781305115545Author:James Stewart, Lothar Redlin, Saleem WatsonPublisher:Cengage Learning
College Algebra
Algebra
ISBN:9781305115545
Author:James Stewart, Lothar Redlin, Saleem Watson
Publisher:Cengage Learning
Learn Algebra 6 : Rate of Change; Author: Derek Banas;https://www.youtube.com/watch?v=Dw701mKcJ1k;License: Standard YouTube License, CC-BY