
Connect Hosted by ALEKS Online Access for Elementary Statistics
3rd Edition
ISBN: 9781260373769
Author: William Navidi
Publisher: MCGRAW-HILL HIGHER EDUCATION
expand_more
expand_more
format_list_bulleted
Videos
Textbook Question
Chapter 4.1, Problem 37E
Blood pressure: A blood pressure measurement consists of two numbers: systolic pressure, which is the maximum pressure taken when the heat is contracting, and the diastolic pressure, which is the minimum pressure taken at the beginning of the heartbeat. Blood pressures were measured, in millimeters of mercury, for a sample of 16 adults. The following table presents the results.
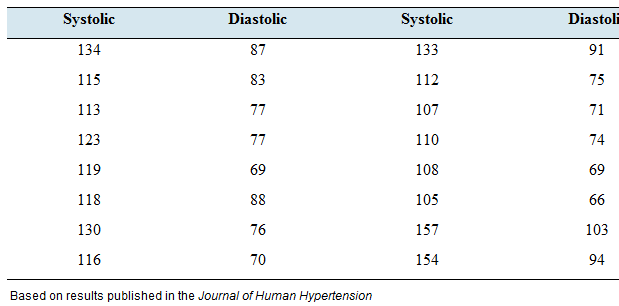
- Construct a
scatterplot of die diastolic blood pressure (y) versus the systolic blood pressure (x). - Compute the
correlation coefficient between systolic and diastolic blood pressure. - If someone’s diastolic pressure is above average, would you expect that person’s systolic pressure to be above or below average? Explain.
Expert Solution & Answer
Want to see the full answer?
Check out a sample textbook solution
Students have asked these similar questions
Glaucoma is a leading cause of blindness in the United States, N. Ehlers measured the difference in corneal thickness (in microns) between the two eyes of eight patients. Each patient had one eye that had glaucoma and one eye that was normal. The difference was measured as the corneal thickness of normal eye – corneal thickness of eye with Glaucoma. Corneal thickness is important because it can mask an accurate reading of eye pressure.
Use ? = .05
H0: μd=0
H1: μd≠0
T statistic: t = 1.053, P value = 0.327
Degrees of Freedom
n-1 = 8-1= 7
critical value
2.3646
If t is less than 2.3646, or greater than 2.3646, reject the null hypothesis
Level of significance:
α=0.05
question:
what a type 1 error and type 2 error would mean. Is it possible that we could have committed a type 2 error in conducting the test
Glaucoma is a leading cause of blindness in the United States, N. Ehlers measured the difference in corneal thickness (in microns) between the two eyes of eight patients. Each patient had one eye that had glaucoma and one eye that was normal. The difference was measured as the corneal thickness of normal eye – corneal thickness of eye with Glaucoma. Corneal thickness is important because it can mask an accurate reading of eye pressure. Use ? = .05.
Q) If a participant has the same corneal thickness in their normal eye as the eye with Glaucoma, what would be the value for difference: measured as the corneal thickness of normal eye – corneal thickness of eye with Glaucoma.
Glaucoma is a leading cause of blindness in the United States, N. Ehlers measured the difference in corneal thickness (in microns) between the two eyes of eight patients. Each patient had one eye that had glaucoma and one eye that was normal. The difference was measured as the corneal thickness of normal eye – corneal thickness of eye with Glaucoma. Corneal thickness is important because it can mask an accurate reading of eye pressure. Use ? = .05.
Q)Conduct a hypothesis test to determine if there is sufficient evidence to conclude that corneal thickness is different in normal eyes compared to eyes with glaucoma? Write up your results using the 8 steps.
Chapter 4 Solutions
Connect Hosted by ALEKS Online Access for Elementary Statistics
Ch. 4.1 - In Exercises 9-12, fill in each blank with the...Ch. 4.1 - In Exercises 9-12, fill in each blank with the...Ch. 4.1 - In Exercises 9-12, fill in each blank with the...Ch. 4.1 - In Exercises 9-12, fill in each blank with the...Ch. 4.1 - Prob. 13ECh. 4.1 - Prob. 14ECh. 4.1 - In Exercises 13-16, determine whether the...Ch. 4.1 - In Exercises 13-16, determine whether the...Ch. 4.1 - In Exercises 17-20, compute the correlation...Ch. 4.1 - In Exercises 17-20, compute the correlation...
Ch. 4.1 - In Exercises 17-20, compute the correlation...Ch. 4.1 - In Exercises 17-20, compute the correlation...Ch. 4.1 - In Exercises 21-24, determine whether the...Ch. 4.1 - In Exercises 21-24, determine whether the...Ch. 4.1 - In Exercises 21-24, determine whether the...Ch. 4.1 - In Exercises 21-24, determine whether the...Ch. 4.1 - In Exercises 25-30, determine whether the...Ch. 4.1 - In Exercises 25-30, determine whether the...Ch. 4.1 - In Exercises 25-30, determine whether the...Ch. 4.1 - In Exercises 25-30, determine whether the...Ch. 4.1 - In Exercises 25-30, determine whether the...Ch. 4.1 - In Exercises 25-30, determine whether the...Ch. 4.1 - Price of eggs and milk: The following table...Ch. 4.1 - Government funding: The following table presents...Ch. 4.1 - Pass the ball: The following table lists the...Ch. 4.1 - Carbon footprint: Carbon dioxide (CO2) is produced...Ch. 4.1 - Foot temperatures: Foot ulcers are a common...Ch. 4.1 - Mortgage payments: The following table presents...Ch. 4.1 - Blood pressure: A blood pressure measurement...Ch. 4.1 - Prob. 38ECh. 4.1 - Police and crime: In a survey of cities in the...Ch. 4.1 - Age and education: A survey of U.S. adults showed...Ch. 4.1 - Whats the correlation? In a sample of adults, the...Ch. 4.1 - Prob. 42ECh. 4.1 - Changing means and standard deviations: A small...Ch. 4.2 - In Exercises 5-7, fill in each blank with the...Ch. 4.2 - In Exercises 5-7, fill in each blank with the...Ch. 4.2 - In Exercises 5-7, fill in each blank with the...Ch. 4.2 - Prob. 8ECh. 4.2 - Prob. 9ECh. 4.2 - Prob. 10ECh. 4.2 - Prob. 11ECh. 4.2 - Prob. 12ECh. 4.2 - In Exercises 13-16, compute the least-squares...Ch. 4.2 - In Exercises 13-16, compute the least-squares...Ch. 4.2 - In Exercises 13-16, compute the least-squares...Ch. 4.2 - In Exercises 13-16, compute the least-squares...Ch. 4.2 - Compute the least-squares regression he for...Ch. 4.2 - Compute the least-squares regression he for...Ch. 4.2 - In a hypothetical study of the relationship...Ch. 4.2 - Assume in a study of educational level in years...Ch. 4.2 - Price of eggs and milk: The following table...Ch. 4.2 - Government funding: The following table presents...Ch. 4.2 - Pass the ball: The following table lists the...Ch. 4.2 - Carbon footprint: Carbon dioxide (CO2) is produced...Ch. 4.2 - Foot temperatures: Foot ulcers are a common...Ch. 4.2 - Mortgage payments: The following table presents...Ch. 4.2 - Blood pressure: A blood pressure measurement...Ch. 4.2 - Butterfly wings: Do larger butterflies live...Ch. 4.2 - Interpreting technology: The following display...Ch. 4.2 - Interpreting technology: The following display...Ch. 4.2 - Interpreting technology: The following MINITAB...Ch. 4.2 - Interpreting technology: The following MINITAB...Ch. 4.2 - Prob. 33ECh. 4.2 - Prob. 34ECh. 4.2 - Least-squares regression line for z-scores: The...Ch. 4.3 - In Exercises 5-10, fill in each blank with the...Ch. 4.3 - In Exercises 5-10, fill in each blank with the...Ch. 4.3 - In Exercises 5-10, fill in each blank with the...Ch. 4.3 - In Exercises 5-10, fill in each blank with the...Ch. 4.3 - In Exercises 5-10, fill in each blank with the...Ch. 4.3 - Prob. 10ECh. 4.3 - Prob. 11ECh. 4.3 - In Exercises 11-14, determine whether the...Ch. 4.3 - Prob. 13ECh. 4.3 - In Exercises 11-14, determine whether the...Ch. 4.3 - For the following data set: Compute the...Ch. 4.3 - For the following data set: Compute the...Ch. 4.3 - For the following data set: Compute the...Ch. 4.3 - For the following data set: Compute the...Ch. 4.3 - Prob. 19ECh. 4.3 - Prob. 20ECh. 4.3 - Prob. 21ECh. 4.3 - Prob. 22ECh. 4.3 - Hot enough for you? The following table presents...Ch. 4.3 - Presidents and first ladies: The presents the ages...Ch. 4.3 - Mutant genes: In a study to determine whether the...Ch. 4.3 - Imports and exports: The following table presents...Ch. 4.3 - Energy consumption: The following table presents...Ch. 4.3 - Cost of health care: The following table presents...Ch. 4.3 - Prob. 29ECh. 4.3 - Prob. 30ECh. 4.3 - Prob. 31ECh. 4.3 - Transforming a variable: The following table...Ch. 4.3 - Prob. 33ECh. 4.3 - Prob. 34ECh. 4 - Compute the correlation coefficient for the...Ch. 4 - The number of theaters showing the movie Monsters...Ch. 4 - Use the data in Exercise 2 to compute the...Ch. 4 - A scatterplot has a correlation of r=1. Describe...Ch. 4 - Prob. 5CQCh. 4 - Prob. 6CQCh. 4 - Use the least-squares regression line computed in...Ch. 4 - Use the least-squares regression line computed in...Ch. 4 - Prob. 9CQCh. 4 - A scatterplot has a least-squares regression line...Ch. 4 - Prob. 11CQCh. 4 - Prob. 12CQCh. 4 - A sample of students was studied to determine the...Ch. 4 - In a scatter-plot; the point (-2, 7) is...Ch. 4 - The correlation coefficient for a data set is...Ch. 4 - Prob. 1RECh. 4 - Prob. 2RECh. 4 - Hows your mileage? Weight (in tons) and fuel...Ch. 4 - Prob. 4RECh. 4 - Energy efficiency: A sample of 10 households was...Ch. 4 - Energy efficiency: Using the data in Exercise 5:...Ch. 4 - Prob. 7RECh. 4 - Prob. 8RECh. 4 - Prob. 9RECh. 4 - Prob. 10RECh. 4 - Baby weights: The average gestational age (time...Ch. 4 - Commute times: Every morning, Tania leaves for...Ch. 4 - Prob. 13RECh. 4 - Prob. 14RECh. 4 - Prob. 15RECh. 4 - Describe an example which two variables are...Ch. 4 - Two variables x and y have a positive association...Ch. 4 - Prob. 3WAICh. 4 - Prob. 4WAICh. 4 - Prob. 5WAICh. 4 - Prob. 6WAICh. 4 - Prob. 7WAICh. 4 - Prob. 8WAICh. 4 - Prob. 9WAICh. 4 - The following table, reproduced from the chapter...Ch. 4 - Prob. 2CSCh. 4 - Prob. 3CSCh. 4 - Prob. 4CSCh. 4 - Prob. 5CSCh. 4 - Prob. 6CSCh. 4 - Prob. 7CSCh. 4 - Prob. 8CSCh. 4 - Prob. 9CSCh. 4 - Prob. 10CSCh. 4 - Prob. 11CSCh. 4 - Prob. 12CSCh. 4 - Prob. 13CSCh. 4 - If we are going to use data from this year to...Ch. 4 - Prob. 15CS
Knowledge Booster


Learn more about
Need a deep-dive on the concept behind this application? Look no further. Learn more about this topic, statistics and related others by exploring similar questions and additional content below.Similar questions
- Find the mean hourly cost when the cell phone described above is used for 240 minutes.arrow_forwardGlaucoma is a leading cause of blindness in the United States, N. Ehlers measured the difference in corneal thickness (in microns) between the two eyes of eight patients. Each patient had one eye that had glaucoma and one eye that was normal. The difference was measured as the corneal thickness of normal eye – corneal thickness of eye with Glaucoma. Corneal thickness is important because it can mask an accurate reading of eye pressure. Use ? = .05. Hypothesis: H0: μd=0Ha: μd≠0 Using output Test statistics : t=0.134P value=0.897 Degrees of freedom (df): df=7 Level of significance: α=0.05 Decision: P value > 0.05 thus we fails to reject null hypothesis. Question a)Write a report summarizing your findings. When writing the report consider that medical staff estimate that a difference of 4.5 microns or more could impact on their ability to interpret eye pressure correctly. b) Define for the hypothesis stated in part b) what a type 1 error and type 2 error would mean. Is it possible…arrow_forwardThe 5- number summary is 0.53, 0.74, 1.19, 1.355, and 1.49arrow_forward
- If someone's diastolic pressure is above average, would you expect that person's systolic pressure to be above or below average?arrow_forwardFont Everest auto industry produces bearing for Mahindra Motor Corporation. The precision of radrus of bearing is very important for its successful functioning. To check the variability in the bearing radius, the company randomly selected ten bearings and measured the radius, the result of which is as shown in the table below. Nominal radius (cm) #no #no Nominal radius (cm) 2.45 1. 2.70 6. 71 8. 2. 2.65 2.73 3. 2.75 2.64 4. 2.55 9. 2.66 2.76 10 2.83 a. Calculate the sample standard deviation for the above data. b. Construct a box plot and check whether there is any outlier data m the data distribution. c. Based on the comparison between the mean and the quartile, identify the shape of the data distribution. d. Calculate the 55 percentile and interpret the result. e. What is the range of the data distribution? Explain sts meaning. d States)arrow_forwardBody mass index (BMI) is a measure of body composition, which can be used to assess if someone is underweight, healthy weight, overweight but not obese, or obese. It is calculated as a person's weight (measured in Kilograms) divided by his/her height (measured in meters) squared. We recorded 5 students' BMI values and the numbers of hours they exercised in the past week, as following: BMI Hours of exercise 18.4 3.0 What is the value of r? 19.6 2.5 20.5 4.0 27.6 2.7 30.6 0.5arrow_forward
- HW TEN Options for part (b) a. "Z" b. "t" c. "Chi-square" d. "F"arrow_forwardThe quality control engineer at Palmer Industries is interested in estimating the tensile strength of steel wire based on its outside diameter and the amount of molybdenum in the steel. As an experiment, she selected 25 pieces of wire, measured the outside diameters, and determined the molybdenum content. Then she measured the tensile strength of each piece. The results of the first four are recorded in the table. Tensile Strength Outside Diameter Amount of Molybdenum Place (PSI ) Y (mm) X1 (Units) X2 A 11 0.3 6 B 9 0.2 5 C 16 0.4 8 D 12 0.3 7 Using a statistical software package, the QC engineer determined the multiple regression equation to be Y’=-0.5+20X1+1X2. a) Based on the equation, what is the estimated tensile strength of a steel wire having an outside diameter of .35 mm and 6.4 units of molybdenum? b) Interpret the value of b1 in the equation.arrow_forwardThe histogram below presents the compressive strengths of a sample of concrete blocks hardened for 28 days. One rectangle from the histogram is missing. What is its height? 0.3 0.25 0.2- 0.15 0.1 0.05 17 18 19 20 21 22 23 24 Compressive Strength (mPa) Relative Frequencyarrow_forward
- Calculate the number of samples needed (margin of error =5%)for the population you are assigned with using the following a Cochran’s formula (z=1.96,p=0.6) b slovens formulaarrow_forwardA sample of ore is found to be 0.0022% gold and 0.059% silver. What is the percentage of matter in the ore that is neither gold or silver?arrow_forwardHigh cholesterol is one of the major risk factors for heart disease. A total cholesterol reading above 190 mg/dL is considered high.A physician is concerned that a patient may be at risk for high cholesterol. In order to accurately measure the patient's average cholesterol level, the physician instructs the patient to come into the physician's office once a week for 12 weeks for a blood lipid screening. The results of the 12 measurements are listed below. 189 186 199 197 190 186 185 200 200 200 185 190 Use the critical value method to test the hypothesis that the patient's cholesterol level is greater than 190 mg/dL, using a significance level of 10%. Assume that the distribution of all cholesterol measurements from this patient is approximately normally distributed. Determine the critical value(s) for this hypothesis test. Round the solution(s) to four decimal places. If more than one critical value exists, enter the solutions using a comma-separated list.Determine the test…arrow_forward
arrow_back_ios
SEE MORE QUESTIONS
arrow_forward_ios
Recommended textbooks for you
 Holt Mcdougal Larson Pre-algebra: Student Edition...AlgebraISBN:9780547587776Author:HOLT MCDOUGALPublisher:HOLT MCDOUGAL
 Trigonometry (MindTap Course List)TrigonometryISBN:9781337278461Author:Ron LarsonPublisher:Cengage Learning
 Glencoe Algebra 1, Student Edition, 9780079039897...AlgebraISBN:9780079039897Author:CarterPublisher:McGraw Hill
 Big Ideas Math A Bridge To Success Algebra 1: Stu...AlgebraISBN:9781680331141Author:HOUGHTON MIFFLIN HARCOURTPublisher:Houghton Mifflin Harcourt
 Algebra: Structure And Method, Book 1AlgebraISBN:9780395977224Author:Richard G. Brown, Mary P. Dolciani, Robert H. Sorgenfrey, William L. ColePublisher:McDougal Littell
Holt Mcdougal Larson Pre-algebra: Student Edition...
Algebra
ISBN:9780547587776
Author:HOLT MCDOUGAL
Publisher:HOLT MCDOUGAL
Trigonometry (MindTap Course List)
Trigonometry
ISBN:9781337278461
Author:Ron Larson
Publisher:Cengage Learning
Glencoe Algebra 1, Student Edition, 9780079039897...
Algebra
ISBN:9780079039897
Author:Carter
Publisher:McGraw Hill
Big Ideas Math A Bridge To Success Algebra 1: Stu...
Algebra
ISBN:9781680331141
Author:HOUGHTON MIFFLIN HARCOURT
Publisher:Houghton Mifflin Harcourt
Algebra: Structure And Method, Book 1
Algebra
ISBN:9780395977224
Author:Richard G. Brown, Mary P. Dolciani, Robert H. Sorgenfrey, William L. Cole
Publisher:McDougal Littell
Hypothesis Testing using Confidence Interval Approach; Author: BUM2413 Applied Statistics UMP;https://www.youtube.com/watch?v=Hq1l3e9pLyY;License: Standard YouTube License, CC-BY
Hypothesis Testing - Difference of Two Means - Student's -Distribution & Normal Distribution; Author: The Organic Chemistry Tutor;https://www.youtube.com/watch?v=UcZwyzwWU7o;License: Standard Youtube License