
Connect Hosted by ALEKS Online Access for Elementary Statistics
3rd Edition
ISBN: 9781260373769
Author: William Navidi
Publisher: MCGRAW-HILL HIGHER EDUCATION
expand_more
expand_more
format_list_bulleted
Concept explainers
Videos
Textbook Question
Chapter 4, Problem 2CQ
The number of theaters showing the movie Monsters University x days after opening presented in the following table.
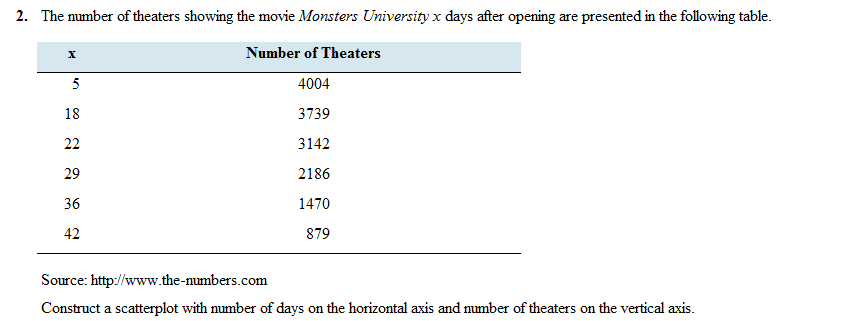
Construct a
Expert Solution & Answer
Want to see the full answer?
Check out a sample textbook solution
Students have asked these similar questions
MarkLines is an online portal (www.marklines.com) that reports automotive industry data. The table below shows the number of cars sold in the United States from January to November in 2017 and 2018. The top 22 manufacturers, plus others, are listed here. Sales data often is reported in this way to compare current sales to last year’s sales.
Car Sales
Manufacturer
Jan.-Nov.2017
Jan.-Nov.2018
GM (Est.)
2,691,493
2,654,568
Ford
2,334,290
2,265,590
Toyota
2,211,533
2,205,762
Fiat Chrysler
1,887,430
2,038,684
Honda
1,492,112
1,449,713
Nissan
1,455,238
1,345,157
Hyundai
621,961
612,225
Subaru
584,614
615,594
Kia
546,629
542,245
Mercedes (includes Sprinter)
332,990
318,012
BMW
271,432
276,657
VW
309,395
322,017
Mazda
262,577
274,455
Audi
199,534
200,558
Tesla (Est.)
40,320
106,050
Land Rover
66,759
81,526
Volvo
71828
89437
Mitsubishi
95,185
109,088
Porsche
51,507
53,116
MINI
42,494
40,887
Jaguar
36,180
27,021
Others
18,901
17,251
smart…
uppose Laura, a facilities manager at a health and wellness company, wants to estimate the difference in the average amount of time that men and women spend at the company's fitness centers each week.
Laura randomly selects 13 adult male fitness center members from the membership database and then selects 13 adult female members from the database. Laura gathers data from the past month containing logged time at the fitness center for these members. She plans to use the data to estimate the difference in the time men and women spend per week at the fitness center. The sample statistics are summarized in the table.
Population
Populationdescription
Population mean(unknown)
Samplesize
Sample mean(min)
Sample standarddeviation (min)
1
male
?1
?1=13
?⎯⎯⎯1=132.5
?1=45.3
2
female
?2
?2=13
?⎯⎯⎯2=108.7
?2=31.1
df=21.256
The population standard deviations are unknown and unlikely to be equal, based on the sample data. Laura plans to use the two-sample ?-procedures to estimate the…
Guadalajara Tours' daily sightseeing trip has a capacity of 55 people. Each day, tour officials record the number of people making the trip. The data for a
selection of 22 summer days are as follows.
31, 36, 41, 42, 43, 43, 46, 46, 46, 47, 47, 49, 51, 51, 51, 51, 52, 52, 52, 54, 54, 54
Send data to calculator
Send data to Excel
Frequency
10-
10
6+
4
4.
2+
1.
0-
30
35
40
45
50
55
Number of people on trip
OMean
(a) For these data, which measures of
central tendency take more than one value?
Choose all that apply.
OMedian
Mode
ONone of these measures
OMean
(b) Suppose that the measurement 31 (the
smallest measurement in the data set) were
OMedian
replaced by 15. Which measures of central
OMode
tondoncu would bo offoctod by the chano02
Explanation
Check
O 2021 McGraw-Hill Education. All Rights Reserved. Terms of Use Privacy Access
APA
pe here to search
99+
Chapter 4 Solutions
Connect Hosted by ALEKS Online Access for Elementary Statistics
Ch. 4.1 - In Exercises 9-12, fill in each blank with the...Ch. 4.1 - In Exercises 9-12, fill in each blank with the...Ch. 4.1 - In Exercises 9-12, fill in each blank with the...Ch. 4.1 - In Exercises 9-12, fill in each blank with the...Ch. 4.1 - Prob. 13ECh. 4.1 - Prob. 14ECh. 4.1 - In Exercises 13-16, determine whether the...Ch. 4.1 - In Exercises 13-16, determine whether the...Ch. 4.1 - In Exercises 17-20, compute the correlation...Ch. 4.1 - In Exercises 17-20, compute the correlation...
Ch. 4.1 - In Exercises 17-20, compute the correlation...Ch. 4.1 - In Exercises 17-20, compute the correlation...Ch. 4.1 - In Exercises 21-24, determine whether the...Ch. 4.1 - In Exercises 21-24, determine whether the...Ch. 4.1 - In Exercises 21-24, determine whether the...Ch. 4.1 - In Exercises 21-24, determine whether the...Ch. 4.1 - In Exercises 25-30, determine whether the...Ch. 4.1 - In Exercises 25-30, determine whether the...Ch. 4.1 - In Exercises 25-30, determine whether the...Ch. 4.1 - In Exercises 25-30, determine whether the...Ch. 4.1 - In Exercises 25-30, determine whether the...Ch. 4.1 - In Exercises 25-30, determine whether the...Ch. 4.1 - Price of eggs and milk: The following table...Ch. 4.1 - Government funding: The following table presents...Ch. 4.1 - Pass the ball: The following table lists the...Ch. 4.1 - Carbon footprint: Carbon dioxide (CO2) is produced...Ch. 4.1 - Foot temperatures: Foot ulcers are a common...Ch. 4.1 - Mortgage payments: The following table presents...Ch. 4.1 - Blood pressure: A blood pressure measurement...Ch. 4.1 - Prob. 38ECh. 4.1 - Police and crime: In a survey of cities in the...Ch. 4.1 - Age and education: A survey of U.S. adults showed...Ch. 4.1 - Whats the correlation? In a sample of adults, the...Ch. 4.1 - Prob. 42ECh. 4.1 - Changing means and standard deviations: A small...Ch. 4.2 - In Exercises 5-7, fill in each blank with the...Ch. 4.2 - In Exercises 5-7, fill in each blank with the...Ch. 4.2 - In Exercises 5-7, fill in each blank with the...Ch. 4.2 - Prob. 8ECh. 4.2 - Prob. 9ECh. 4.2 - Prob. 10ECh. 4.2 - Prob. 11ECh. 4.2 - Prob. 12ECh. 4.2 - In Exercises 13-16, compute the least-squares...Ch. 4.2 - In Exercises 13-16, compute the least-squares...Ch. 4.2 - In Exercises 13-16, compute the least-squares...Ch. 4.2 - In Exercises 13-16, compute the least-squares...Ch. 4.2 - Compute the least-squares regression he for...Ch. 4.2 - Compute the least-squares regression he for...Ch. 4.2 - In a hypothetical study of the relationship...Ch. 4.2 - Assume in a study of educational level in years...Ch. 4.2 - Price of eggs and milk: The following table...Ch. 4.2 - Government funding: The following table presents...Ch. 4.2 - Pass the ball: The following table lists the...Ch. 4.2 - Carbon footprint: Carbon dioxide (CO2) is produced...Ch. 4.2 - Foot temperatures: Foot ulcers are a common...Ch. 4.2 - Mortgage payments: The following table presents...Ch. 4.2 - Blood pressure: A blood pressure measurement...Ch. 4.2 - Butterfly wings: Do larger butterflies live...Ch. 4.2 - Interpreting technology: The following display...Ch. 4.2 - Interpreting technology: The following display...Ch. 4.2 - Interpreting technology: The following MINITAB...Ch. 4.2 - Interpreting technology: The following MINITAB...Ch. 4.2 - Prob. 33ECh. 4.2 - Prob. 34ECh. 4.2 - Least-squares regression line for z-scores: The...Ch. 4.3 - In Exercises 5-10, fill in each blank with the...Ch. 4.3 - In Exercises 5-10, fill in each blank with the...Ch. 4.3 - In Exercises 5-10, fill in each blank with the...Ch. 4.3 - In Exercises 5-10, fill in each blank with the...Ch. 4.3 - In Exercises 5-10, fill in each blank with the...Ch. 4.3 - Prob. 10ECh. 4.3 - Prob. 11ECh. 4.3 - In Exercises 11-14, determine whether the...Ch. 4.3 - Prob. 13ECh. 4.3 - In Exercises 11-14, determine whether the...Ch. 4.3 - For the following data set: Compute the...Ch. 4.3 - For the following data set: Compute the...Ch. 4.3 - For the following data set: Compute the...Ch. 4.3 - For the following data set: Compute the...Ch. 4.3 - Prob. 19ECh. 4.3 - Prob. 20ECh. 4.3 - Prob. 21ECh. 4.3 - Prob. 22ECh. 4.3 - Hot enough for you? The following table presents...Ch. 4.3 - Presidents and first ladies: The presents the ages...Ch. 4.3 - Mutant genes: In a study to determine whether the...Ch. 4.3 - Imports and exports: The following table presents...Ch. 4.3 - Energy consumption: The following table presents...Ch. 4.3 - Cost of health care: The following table presents...Ch. 4.3 - Prob. 29ECh. 4.3 - Prob. 30ECh. 4.3 - Prob. 31ECh. 4.3 - Transforming a variable: The following table...Ch. 4.3 - Prob. 33ECh. 4.3 - Prob. 34ECh. 4 - Compute the correlation coefficient for the...Ch. 4 - The number of theaters showing the movie Monsters...Ch. 4 - Use the data in Exercise 2 to compute the...Ch. 4 - A scatterplot has a correlation of r=1. Describe...Ch. 4 - Prob. 5CQCh. 4 - Prob. 6CQCh. 4 - Use the least-squares regression line computed in...Ch. 4 - Use the least-squares regression line computed in...Ch. 4 - Prob. 9CQCh. 4 - A scatterplot has a least-squares regression line...Ch. 4 - Prob. 11CQCh. 4 - Prob. 12CQCh. 4 - A sample of students was studied to determine the...Ch. 4 - In a scatter-plot; the point (-2, 7) is...Ch. 4 - The correlation coefficient for a data set is...Ch. 4 - Prob. 1RECh. 4 - Prob. 2RECh. 4 - Hows your mileage? Weight (in tons) and fuel...Ch. 4 - Prob. 4RECh. 4 - Energy efficiency: A sample of 10 households was...Ch. 4 - Energy efficiency: Using the data in Exercise 5:...Ch. 4 - Prob. 7RECh. 4 - Prob. 8RECh. 4 - Prob. 9RECh. 4 - Prob. 10RECh. 4 - Baby weights: The average gestational age (time...Ch. 4 - Commute times: Every morning, Tania leaves for...Ch. 4 - Prob. 13RECh. 4 - Prob. 14RECh. 4 - Prob. 15RECh. 4 - Describe an example which two variables are...Ch. 4 - Two variables x and y have a positive association...Ch. 4 - Prob. 3WAICh. 4 - Prob. 4WAICh. 4 - Prob. 5WAICh. 4 - Prob. 6WAICh. 4 - Prob. 7WAICh. 4 - Prob. 8WAICh. 4 - Prob. 9WAICh. 4 - The following table, reproduced from the chapter...Ch. 4 - Prob. 2CSCh. 4 - Prob. 3CSCh. 4 - Prob. 4CSCh. 4 - Prob. 5CSCh. 4 - Prob. 6CSCh. 4 - Prob. 7CSCh. 4 - Prob. 8CSCh. 4 - Prob. 9CSCh. 4 - Prob. 10CSCh. 4 - Prob. 11CSCh. 4 - Prob. 12CSCh. 4 - Prob. 13CSCh. 4 - If we are going to use data from this year to...Ch. 4 - Prob. 15CS
Knowledge Booster


Learn more about
Need a deep-dive on the concept behind this application? Look no further. Learn more about this topic, statistics and related others by exploring similar questions and additional content below.Similar questions
- The Wall Street Journal’s website, www.wsj.com, reported the number of cars and light-duty trucks sold through October of 2014 and October of 2015. The top sixteen manufacturers are listed here. The sales information for all manufacturers can be accessed in a data file below. Sales data are often reported in this way to compare current sales to last year’s sales. Year-to-Date Sales Manufacturer Through October 2015 Through October 2014 General Motors Corp. 2,562,840 2,434,707 Ford Motor Company 2,178,587 2,065,612 Toyota Motor Sales USA Inc. 2,071,446 1,975,368 Chrysler 1,814,268 1,687,313 American Honda Motor Co Inc. 1,320,217 1,281,777 Nissan North America Inc. 1,238,535 1,166,389 Hyundai Motor America 638,195 607,539 Kia Motors America Inc. 526,024 489,711 Subaru of America Inc. 480,331 418,497 Volkswagen of America Inc. 294,602 301,187 Mercedes-Benz 301,915 281,728 BMW of North America Inc.…arrow_forwardThe manager of a car dealership records the 3. Identify the type of data collected. colors of automobiles on a used car lot.arrow_forwardfind mode of the data 2,3,4,5,6,7,7,6,5,5,5,4,2,1,0,10,77,88,arrow_forward
- The following table shows the length, in centimeters, of the humerus and the total wingspan, in centimeters, of several pterosaurs, which are extinct flying reptiles.arrow_forwardThe average monthly residential gas bill for Black Hills Energy customers in Cheyenne, Wyoming is (Wyoming Public Service Commission website). How is the average monthly gas bill for a Cheyenne residence related to the square footage, number of rooms, and age of the residence? The following data show the average monthly gas bill for last year, square footage, number of rooms, and age for typical Cheyenne residences. Average Monthly Gas Number of Bill for Last Year Age Square Footage Rooms $70.20 16 2537 6 $81.33 2 3437 8 $45.86 27 976 6 $59.21 11 1713 7 $117.88 16 3979 11 $57.78 2 1328 7 $47.01 27 1251 6 $52.89 4 827 5 $32.90 12 645 4 $67.04 29 2849 5 $76.76 1 2392 7 $60.40 26 900 5 $44.07 14 1386 5 $26.68 20 1299 4 $62.70 17 1441 6 $45.37 13 562 4 $38.09 10 2140 4 $45.31 22 908 6 $52.45 24 1568 5 $96.11 27 1140 10…arrow_forwardBlock: _ Date. Five year-old Susie's parents are concerned that she seems short for her age. Their doctor has the followng rer of Susie' height: Age (months): 20 30 45 50 57 60 Height (cm): 80 86 87 90 91 94 (a) Make a scatterplot of these data:arrow_forward
- What is the linear pattern of 4500 students in 2014 and 3700 students in 2019arrow_forwardOn December 17, 2007 baseball writer John Hickey wrote an article for the Seattle P-I about increases to ticket prices for Seattle Mariners games during the 2008 season. The article included a data set that listed the average ticket price for each MLB team, the league in which the team plays (AL or NL), the number of wins during the 2007 season and the cost per win (in dollars). The data for the 16 National League teams are shown below. team league price wins cost/win Arizona Diamondbacks NL 19.68 90 35.40 Atlanta Braves NL 17.07 84 32.89 Chicago Cubs NL 34.30 85 65.33 Cincinnati Reds NL 17.90 72 40.32 Colorado Rockies NL 14.72 90 26.67 Florida Marlins NL 16.70 71 38.13 Houston Astros NL 26.66 73 59.11 Los Angeles Dodgers NL 20.09 82 34.64 Milwaukee Brewers NL 18.11 83 35.37 N.Y. Mets NL 25.28 88 46.56 Philadelphia Phillies NL 26.73 89 48.69 Pittsburgh Pirates NL 17.08 68 40.67 San Diego Padres NL 20.83 89 38.15 San Francisco Giants NL 24.53 71…arrow_forward
arrow_back_ios
arrow_forward_ios
Recommended textbooks for you
 Glencoe Algebra 1, Student Edition, 9780079039897...AlgebraISBN:9780079039897Author:CarterPublisher:McGraw Hill
 Holt Mcdougal Larson Pre-algebra: Student Edition...AlgebraISBN:9780547587776Author:HOLT MCDOUGALPublisher:HOLT MCDOUGAL
 Algebra: Structure And Method, Book 1AlgebraISBN:9780395977224Author:Richard G. Brown, Mary P. Dolciani, Robert H. Sorgenfrey, William L. ColePublisher:McDougal Littell
 Mathematics For Machine TechnologyAdvanced MathISBN:9781337798310Author:Peterson, John.Publisher:Cengage Learning,
Glencoe Algebra 1, Student Edition, 9780079039897...
Algebra
ISBN:9780079039897
Author:Carter
Publisher:McGraw Hill
Holt Mcdougal Larson Pre-algebra: Student Edition...
Algebra
ISBN:9780547587776
Author:HOLT MCDOUGAL
Publisher:HOLT MCDOUGAL
Algebra: Structure And Method, Book 1
Algebra
ISBN:9780395977224
Author:Richard G. Brown, Mary P. Dolciani, Robert H. Sorgenfrey, William L. Cole
Publisher:McDougal Littell
Mathematics For Machine Technology
Advanced Math
ISBN:9781337798310
Author:Peterson, John.
Publisher:Cengage Learning,
Correlation Vs Regression: Difference Between them with definition & Comparison Chart; Author: Key Differences;https://www.youtube.com/watch?v=Ou2QGSJVd0U;License: Standard YouTube License, CC-BY
Correlation and Regression: Concepts with Illustrative examples; Author: LEARN & APPLY : Lean and Six Sigma;https://www.youtube.com/watch?v=xTpHD5WLuoA;License: Standard YouTube License, CC-BY