
Videos
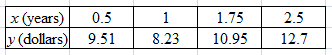
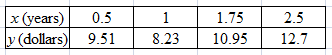
Changing means and standard deviations: A small company has five employees. The following table presents the number of years each has been employed (x) and the wage dollars (y).
x (years) 0.5 1.0 1.75 2.5 3.0
y (dollars) 9.51 8.23 10.95 12.70 12.75
- Compute
- Compute the
correlation coefficient between years of service and hourly wage. - Each employee is given a raise of $1.00 per hour, so each y-value is increased by 1. Using these newy-values, compute the sample mean and the sample standard deviation
- In part (c), each y-value was increased by 1. What was the effect on
- Compute the correlation coefficient between years of service and the increased hourly wage. Explain why the correlation coefficient is unchanged though the y -values have changed.
- Convert x to months by multiplying each x-value by 12. So the new x-values are 6, 12, 21, 30, and 36. Compute the sample mean
- In part (f), each x-value was multiplied by 12. What was the effect on
- Compute the correlation coefficient between months of service and hourly wage in dollars. Explain why the correlation coefficient is unchanged even though the x-values,
- Use the results of parts (a)-(h) to fill in the blank: If a constant is added to each x-value or to each y-value, the correlation coefficient is _____.
- Use the results of parts (a)-(h) to fill in the blank: If each x-value or each y-value is multiplied by a positive constant, the correlation coefficient is____.
a.
The values of
Answer to Problem 43E
Explanation of Solution
Given information:
Given, a small company has five employees and the following table presents the number of years each has been employed

Concepts used:
The correlation coefficient of a data is given by:
Where,
The standard deviations are given by:
Calculation:
The mean of
The mean of
The data can be represented in tabular form as:
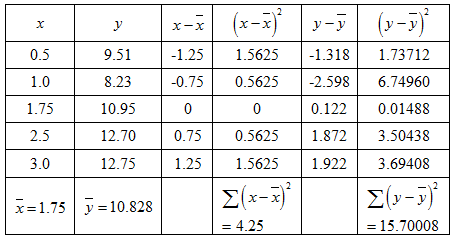
Hence, the standard deviation is given by:
And,
Therefore,
b.
The correlation coefficient between years of service and hourly wage.
Answer to Problem 43E
Explanation of Solution
Given information:
Given, a small company has five employees and the following table presents the number of years each has been employed

Concepts used:
The correlation coefficient of a data is given by:
Where,
The standard deviations are given by:
Calculation:
Consider, 
Hence, the table for calculating coefficient of correlation is given by:
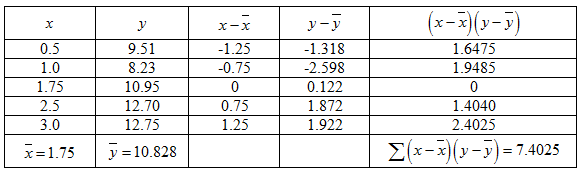
Putting the values in the formula,
Therefore, the correlation coefficient for the given data is
c.
Answer to Problem 43E
Explanation of Solution
Given information:
Given, a small company has five employees and the following table presents the number of years each has been employed
Each employee is given a raise of
Calculation:
When
The standard deviation is given by:
The mean of
The data can be represented in tabular form as:
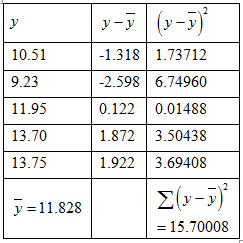
Hence, the standard deviation is given by:
Hence,
d.
The effect of increasing each
Answer to Problem 43E
Explanation of Solution
Given information:
Given, a small company has five employees and the following table presents the number of years each has been employed

Each employee is given a raise of
Calculation:
From part
From part
From the given data, it is observed that when each
e.
The correlation coefficient between years of service and the increased hourly wage. And to explain why the correlation coefficient is unchanged.
Answer to Problem 43E
Since the change did not affect he standard deviation of y, the correlation coefficient has not changed.
Explanation of Solution
Given information:
Given, a small company has five employees and the following table presents the number of years each has been employed

Each employee is given a raise of
Calculation:
From part
From part
From the given data, it is observed that when each
Each employee is given a raise of $1.00 per hour, so each y-value is increased by 1.
Consider, 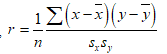
Hence, the table for calculating coefficient of correlation is given by:

Putting the values in the formula,
Therefore, the correlation coefficient for the given data is
Since the change did not affect he standard deviation of
f.
Answer to Problem 43E
Explanation of Solution
Given information:
Given, a small company has five employees and the following table presents the number of years each has been employed

Calculation:
The data can be represented in tabular form as:
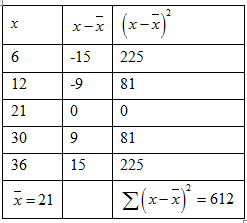
Hence, the standard deviation is given by:
Therefore,
g.
The effect of multiplying each
Answer to Problem 43E
Explanation of Solution
Given information:
Given, a small company has five employees and the following table presents the number of years each has been employed

Calculation:
From part
From part
From the given data, it is observed that when each x-value is multiplied by 12, the mean
h.
The correlation coefficient between months of service and hourly wage. And to explain why the correlation coefficient is unchanged.
Answer to Problem 43E
Both
Explanation of Solution
Given information:
Given, a small company has five employees and the following table presents the number of years each has been employed

Calculation:
Original values:
x is converted to months by multiplying each x-value by 12. So the new x-values are 6, 12, 21, 30 and 36.
So the new values are given by
Consider, 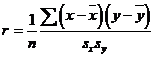
Hence, the table for calculating coefficient of correlation is given by:
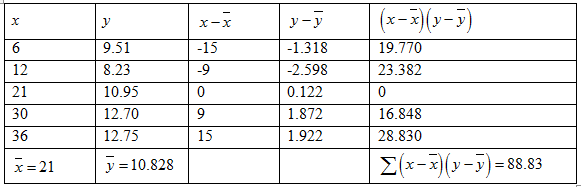
Putting the values in the formula,
Therefore, the correlation coefficient for the given data is
Even though the values of
i.
Using the results in the previous parts, the statement is to be completed by filling the blank.
Answer to Problem 43E
Unchanged.
Explanation of Solution
Given information:
Given statement is: If a constant is added to each x-value or to each y-value, the correlation coefficient is _____.
Calculation:
Given, a small company has five employees and the following table presents the number of years each has been employed

And
Each employee is given a raise of
And the new correlation coefficient is given by
So, when a constant is added to each
j.
Using the results in the previous parts, the statement is to be completed by filling the blank.
Answer to Problem 43E
Unchanged.
Explanation of Solution
Given information:
Given statement is: If each x-value or each y-value is multiplied by a positive constant, the correlation coefficient is _____.
Calculation:
From the previous results:
Given, a small company has five employees and the following table presents the number of years each has been employed
And
And the new correlation coefficient is given by
So, when each
Want to see more full solutions like this?
Chapter 4 Solutions
ELEM. STATISTICS TEXT W/ MANUAL+CONNECT


 Glencoe Algebra 1, Student Edition, 9780079039897...AlgebraISBN:9780079039897Author:CarterPublisher:McGraw Hill