
Concept explainers
Videos
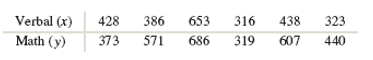
Least-squares regression line for z-scores: The following table presents math and verbal SAT scores for
- Compute the
correlation coefficient between math and verbal SAT score. - Compute the mean and the standard deviation
- Compute the mean and the standard deviation
- Compute the least- squares regression he for predicting math score from verbal score.
- Compute the z-score for each x-value:
- Compute the z-score for each y-value:
- Compute the correlation coefficient r between
- Compute the least-squares regression line for predicting
a.
To compute:The correlation coefficient between math and verbal SAT score.
Answer to Problem 35E
The correlation coefficient is 0.750.
Explanation of Solution
Given information:The following table presents the math and verbal SAT scores for six freshmen.
| Verbal, x | 428 | 386 | 653 | 316 | 438 | 323 |
| Math, y | 373 | 571 | 686 | 319 | 607 | 440 |
Formula used:The correlation coefficient is given by
Calculation:
From the table, the number of variables is
The means of x and y are given by
The standard deviations of x and y are
| Verbal, x | Math, y | ||
| 428 | 373 | 4 | -126.33 |
| 386 | 571 | -38 | 71.67 |
| 653 | 686 | 229 | 186.61 |
| 316 | 319 | -108 | -180.33 |
| 438 | 607 | 14 | 107.67 |
| 323 | 440 | -101 | -59.33 |
| 16 | 15959.2689 |
| 1444 | 5136.5889 |
| 52441 | 34823.2921 |
| 11664 | 32518.9089 |
| 196 | 11592.8289 |
| 10,201 | 3520.0489 |
| 0.0325 | -0.8778 | -0.0285 |
| -0.3083 | 0.4980 | 0.1535 |
| 1.8579 | 1.2967 | 2.4091 |
| -0.8762 | -1.2531 | 1.098 |
| 0.1136 | 0.7482 | 0.085 |
| -0.8194 | -0.4123 | 0.3378 |
The correlation coefficient is
Hence, the correlation coefficient is 0.750.
b.
To compute:The mean
Answer to Problem 35E
The mean and standard deviation of x are
Explanation of Solution
Given information:The following table presents the math and verbal SAT scores for six freshmen.
| Verbal, x | 428 | 386 | 653 | 316 | 438 | 323 |
| Math, y | 373 | 571 | 686 | 319 | 607 | 440 |
Formula used:
Calculation:
The mean of verbal, x is given by
The standard deviations of x is
Hence, the mean and standard deviation of x are
c.
To compute: The mean
Answer to Problem 35E
The mean and standard deviation of y are
Explanation of Solution
Given information:The following table presents the math and verbal SAT scores for six freshmen.
| Verbal, x | 428 | 386 | 653 | 316 | 438 | 323 |
| Math, y | 373 | 571 | 686 | 319 | 607 | 440 |
Formula used:
Calculation:
The standard deviations of y is
Hence, the mean and standard deviation of y are
d.
To compute: The least-square regression line for predicting math from verbal scores.
Answer to Problem 35E
The least-square regression line for predicting math from verbal scores is
Explanation of Solution
Given information:The following table presents the math and verbal SAT scores for six freshmen.
| Verbal, x | 428 | 386 | 653 | 316 | 438 | 323 |
| Math, y | 373 | 571 | 686 | 319 | 607 | 440 |
Formula used:The least-square regression line for predicting y from x is
Where
Calculation:
We have
Then
Therefore, the least-square regression line for predicting math from verbal scores is
Hence, the least-square regression line for predicting math from verbal scores is
e.
To compute: The z-score for each x-value:
Answer to Problem 35E
The values of
Explanation of Solution
Given information:The following table presents the math and verbal SAT scores for six freshmen.
| Verbal, x | 428 | 386 | 653 | 316 | 438 | 323 |
| Math, y | 373 | 571 | 686 | 319 | 607 | 440 |
Calculation:
The values of
| Verbal, x | Math, y | |
| 428 | 373 | 0.0325 |
| 386 | 571 | -0.3083 |
| 653 | 686 | 1.8579 |
| 316 | 319 | -0.8762 |
| 438 | 607 | 0.1136 |
| 323 | 440 | -0.8194 |
Hence, the values of
f.
To compute: The z-score for each y-value:
Answer to Problem 35E
The values of
Explanation of Solution
Given information:The following table presents the math and verbal SAT scores for six freshmen.
| Verbal, x | 428 | 386 | 653 | 316 | 438 | 323 |
| Math, y | 373 | 571 | 686 | 319 | 607 | 440 |
Calculation:
The values of
| Verbal, x | Math, y | |
| 428 | 373 | -0.8778 |
| 386 | 571 | 0.4980 |
| 653 | 686 | 1.2967 |
| 316 | 319 | -1.2531 |
| 438 | 607 | 0.7482 |
| 323 | 440 | -0.4123 |
Hence, the values of
g.
To compute: The correlation coefficient r between
Answer to Problem 35E
The correlation coefficient r between
Explanation of Solution
Given information:The following table presents the math and verbal SAT scores for six freshmen.
| Verbal, x | 428 | 386 | 653 | 316 | 438 | 323 |
| Math, y | 373 | 571 | 686 | 319 | 607 | 440 |
Formula used:
The correlation coefficient is given by
Calculation:
| 0.0325 | -0.8778 |
| -0.3083 | 0.4980 |
| 1.8579 | 1.2967 |
| -0.8762 | -1.2531 |
| 0.1136 | 0.7482 |
| -0.8194 | -0.4123 |
The standard deviation of
| 0.0325 | -0.8778 | -0.02853 |
| -0.3083 | 0.4980 | -0.1535 |
| 1.8579 | 1.2967 | 2.4091 |
| -0.8762 | -1.2531 | 1.098 |
| 0.1136 | 0.7482 | 0.085 |
| -0.8194 | -0.4123 | 0.3378 |
The correlation coefficient is given by
Hence, the correlation coefficient r between
h.
To compute: The least-square regression line for predicting
Explanation of Solution
Given information:The following table presents the math and verbal SAT scores for six freshmen.
| Verbal, x | 428 | 386 | 653 | 316 | 438 | 323 |
| Math, y | 373 | 571 | 686 | 319 | 607 | 440 |
Formula used: The least-square regression line for predicting y from x is
Where
Calculation:
The least-square regression line for predicting
Where
We have
Then,
Then the least-square regression line for predicting
The least-square regression line for predicting
, the y-intercept is zero, the slope of the least-square regression line is
Want to see more full solutions like this?
Chapter 4 Solutions
ELEM. STATISTICS TEXT W/ MANUAL+CONNECT


 Glencoe Algebra 1, Student Edition, 9780079039897...AlgebraISBN:9780079039897Author:CarterPublisher:McGraw Hill
 Algebra & Trigonometry with Analytic GeometryAlgebraISBN:9781133382119Author:SwokowskiPublisher:Cengage
 Big Ideas Math A Bridge To Success Algebra 1: Stu...AlgebraISBN:9781680331141Author:HOUGHTON MIFFLIN HARCOURTPublisher:Houghton Mifflin Harcourt