
Concept explainers
Videos
Changes in the Air To assess the impact of human activity on the carbon dioxide level in Earth’s atmosphere, it helps to take a long view. One useful data set comes from deep core samples of Antarctic ice. The oldest ice core that has been fully analyzed dates back a bit more than 400,000 years. Air bubbles trapped in the ice provide information about the gas content in Earth’s atmosphere at the time the ice formed. Combining ice core data with more recent direct measurements of atmospheric carbon dioxide—as in FIGURE 46.13—can help scientists put current changes in the atmospheric carbon dioxide into historical perspective.
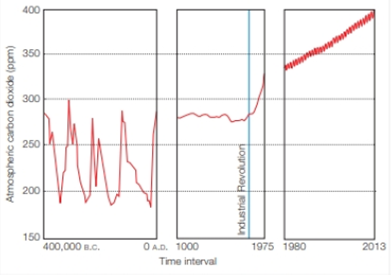
FIGURE 46.13 Changes in atmospheric carbon dioxide levels (in parts per million). Direct measurements began in 1980. Earlier data are based on ice cores.
What was the highest carbon dioxide level between 400,000 B.C. and 0 A.D.?
To determine: The highest carbon dioxide level between 400, 000 B.C. and 0 A.D.
Introduction: The carbon dioxide concentration is rising, and the present-day concentration is highest in 15 million years. It is more of as a result of human activities that contributed in increase in carbon dioxide level in the Earth’s atmosphere. The major contribution is by burning of fossil fuels that releases high amounts of carbon in the atmosphere. This impacts climate and ecosystems.
Answer to Problem 1DAA
Correct answer: The highest carbon dioxide level between 400, 000 B.C. and 0 A.D. is 300 ppm.
Explanation of Solution
Refer Fig. 46.13, “Changes in atmospheric carbon dioxide levels (in parts per million)”, in the textbook. The graphical representation shows the atmospheric carbon dioxide (ppm) measured from deep core samples of Antarctic ice. The air bubbles trapped in the ice gives information regarding the gas content in the Earth’s atmosphere at the time the ice was formed. The oldest ice sample analyzed dates back to more than 400, 000 years. According to the graphical data, the highest level of carbon dioxide between 400, 000 B.C. and 0 A.D was 300 ppm. There were many variations (highs and lows) in the levels during this period.
Want to see more full solutions like this?
Chapter 46 Solutions
Biology: The Unity and Diversity of Life (MindTap Course List)
Additional Science Textbook Solutions
Human Anatomy & Physiology (11th Edition)
Anatomy & Physiology (6th Edition)
Genetics: From Genes to Genomes, 5th edition
Study Guide for Campbell Biology


- Changes in the Air To assess the impact of human activity on the carbon dioxide level in Earth's atmosphere, it helps to take a long view. One useful data set comes from deep core samples of Antarctic ice. The oldest ice core that has been fully analyzed dates back a bit more than 400,000 years. Air bubbles trapped in the ice provide information about the gas content in Earth's atmosphere at the time the ice formed. Combining ice core data with more recent direct measurements of atmospheric carbon dioxideas in FIGURE 46.20can help scientists put current changes in the atmospheric carbon dioxide into historical perspective. FIGURE 46.20 Changes in atmospheric carbon dioxide levels (in parts per million). Direct measurements began in 1980. Earlier data are based on ice cores. 4. Was the rise in the carbon dioxide level between 1800 and 1975 larger or smaller than the rise between 1980 and 2013?arrow_forwardChanges in the Air To assess the impact of human activity on the carbon dioxide level in Earth's atmosphere, it helps to take a long view. One useful data set comes from deep core samples of Antarctic ice. The oldest ice core that has been fully analyzed dates back a bit more than 400,000 years. Air bubbles trapped in the ice provide information about the gas content in Earth's atmosphere at the time the ice formed. Combining ice core data with more recent direct measurements of atmospheric carbon dioxideas in FIGURE 46.20can help scientists put current changes in the atmospheric carbon dioxide into historical perspective. FIGURE 46.20 Changes in atmospheric carbon dioxide levels (in parts per million). Direct measurements began in 1980. Earlier data are based on ice cores. The industrial revolution occurred around 1800. What was the trend in carbon dioxide level in the 800 years prior to this event? What about in the 175 years after it?arrow_forwardGreenhouse gases ________. a. slow the escape of heat from Earth into space b. are produced by natural and human activities c. are at higher levels than they were 100 years ago d. all of the abovearrow_forward
- Mercury Emissions by Continent By weight, coal does not contain much mercury, but we burn a lot of it. Several industries besides coal-fired power plants contribute substantially to atmospheric mercury pollution. FIGURE 2.13 shows mercury emissions by industry from different regions of the world in 2010. FIGURE 2.13 Global mercury emissions by sector, 2010. Which region emitted the most mercury from burning fossil fuels?arrow_forwardIf there are many greenhouse gases, why is only carbon dioxide considered a cause of global warming?a. The other gases do not cause global warming.b. It isn’t. Scientists are concerned about other causes; for example, release of methane from melting permafrost could have significant effects on global warming.c. Other gases occur in such low quantities that they have little effect on the climate.d. Carbon dioxide is the only gas that absorbs long-wavelength infrared radiation.arrow_forwardCarbon is released from organisms as part of cellular respiration. If the organism lives on land, what part of the biosphere is the carbon released into? stratosphere hydrosphere atmosphere lithospherearrow_forward
- Imagine that humans have significantly reduced the amount of greenhouse gas emissions on Earth, but the planet is still warming due to past emissions. How might solar radiation management be implemented to rapidly cool the planet and prevent further impacts of climate change? a. aerosols can be removed from clouds to decrease the amount of cloud condensation nuclei b. sulfur dioxide can be injected into the stratosphere to decrease albedo c. sulfur dioxide can be injected into the atmosphere to increase albedo d. shipping can be regulated to reduce the cloud condensation nuclei of ship tracksarrow_forwardIn a Hadley circulation cell at the Equator: Group of answer choices A. air at the Earth’s surface is warmed by the upper atmosphere, becomes turbulent, and causes hurricanes. B. air is warmed by solar radiation, causing it to sink and become more dense. C. air and water vapor are warmed by solar radiation, causing them rise, cool, and release precipitation. D. air is constantly being pushed downward towards the Earth’s surface by new air coming in from 30ON and 30OS. E. solar radiation and high winds dry out the land.arrow_forwardDescribe one way in which changes in the biosphere can cause changes in the climate system. Next, suggest one way in which the biosphere is affected by changes in some other part of the climate system. Finally indicate one way in which the biosphere records changes in the climate system. Reference page 409 in atmosphere an intro toarrow_forward
- Select the correct terms: (Climate / Weather) is the short-term atmospheric conditions in an area, while (climate / weather) is the average atmospheric conditions in a given area over a long period of time. (Climate change / Global warming) consists of the long-term and largescale changes in atmospheric conditions, which have been brought about by (climate change / global warming), an increase in the average global temperature.arrow_forwardThe burning of fossil fuels releases CO2 into the atmosphereand is detrimental to the Earth’s ecosystems. Explain whythe use of biofuels, which also release CO2, is an improvement over fossil fuels.arrow_forward
 Biology: The Unity and Diversity of Life (MindTap...BiologyISBN:9781305073951Author:Cecie Starr, Ralph Taggart, Christine Evers, Lisa StarrPublisher:Cengage Learning
 Biology: The Unity and Diversity of Life (MindTap...BiologyISBN:9781337408332Author:Cecie Starr, Ralph Taggart, Christine Evers, Lisa StarrPublisher:Cengage Learning
 Biology Today and Tomorrow without Physiology (Mi...BiologyISBN:9781305117396Author:Cecie Starr, Christine Evers, Lisa StarrPublisher:Cengage Learning
 Biology: The Dynamic Science (MindTap Course List)BiologyISBN:9781305389892Author:Peter J. Russell, Paul E. Hertz, Beverly McMillanPublisher:Cengage Learning
 Biology (MindTap Course List)BiologyISBN:9781337392938Author:Eldra Solomon, Charles Martin, Diana W. Martin, Linda R. BergPublisher:Cengage Learning