
Concept explainers
Videos
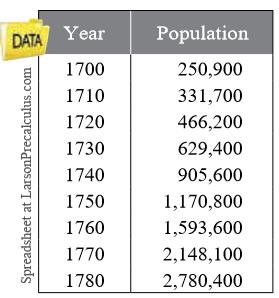
Colonial Population The table shows the colonial population estimates of the American colonies for each decade from 1700 through 1780.
Let
(a) Use the regression feature of a graphing utility to find an exponential model for the data.
(b) Use the regression feature of the graphing utility to find a quadratic model for the data.
(c) Use the graphing utility to plot the data and the models from parts (a) and (b) in the same viewing window.
(d) Which model is a better fit for the data? Would you use this model to predict the population of the United States in 2020? Explain your reasoning.
Want to see the full answer?
Check out a sample textbook solution
Chapter 5 Solutions
College Algebra


- Ventilation Rate In Exercise 21 and 22, use the model y=80.411lnx,100x1500 which approximates the minimum required ventilation rate in terms of the air space per child in a public school classroom. In the model, x is the air space (in cubic feet) per child and y is the ventilation rate (in cubic feet per minute) per child. Use a graphing utility to graph the model and approximate the required ventilation rate when there are 300 cubic feet of air space per child.arrow_forwardDrug Concentration When a drug is administered orally, it takes some time before the blood concentration reaches its maximum level. After that time, concentration levels decrease. When 500 milligrams of procainamide is administered orally, one model for a particular patient gives blood concentration C, in milligrams per liter, after t hours as C=2.65(e0.2te2t) What is the maximum blood-level concentration, and when does that level occur?arrow_forward

 Trigonometry (MindTap Course List)TrigonometryISBN:9781337278461Author:Ron LarsonPublisher:Cengage Learning
 Functions and Change: A Modeling Approach to Coll...AlgebraISBN:9781337111348Author:Bruce Crauder, Benny Evans, Alan NoellPublisher:Cengage Learning
 Algebra & Trigonometry with Analytic GeometryAlgebraISBN:9781133382119Author:SwokowskiPublisher:Cengage