
Managerial Economics: Applications, Strategies and Tactics (MindTap Course List)
14th Edition
ISBN: 9781305506381
Author: James R. McGuigan, R. Charles Moyer, Frederick H.deB. Harris
Publisher: Cengage Learning
expand_more
expand_more
format_list_bulleted
Videos
Textbook Question
Chapter 5, Problem 1.6CE
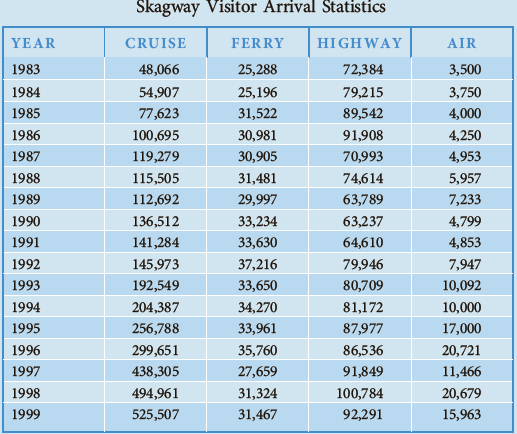
Estimate the double-log (log linear) time trend model for log cruise ship arrivals against log time. Estimate a linear time trend model of cruise ship arrivals against time. Calculate the root mean square error between the predicted and actual value of cruise ship arrivals. Is the root mean square error greater for the double log non-linear time trend model or for the linear time trend model?
Expert Solution & Answer
Want to see the full answer?
Check out a sample textbook solution
Students have asked these similar questions
The forecasting staff for the Prizer Corporation has developed a model to predict sales of its air-cushioned-ride snowmobiles. The model specifies that sales S vary jointly with disposable personal income Y and the population between ages 15 and 40, Z, and inversely with the price of the snowmobiles P. Based on past data, the best estimate of this relationship isS = k (YZ/ P)where k has been estimated (with past data) to equal 100.a. If Y = $11,000, Z = $1,200, and P = $20,000, what value would you predict for S?b. What happens if P is reduced to $17,500?c. How would you go about developing a value for k?d. What are the potential weaknesses of this model?
Comprehensively state the criteria and process of selecting appropriate models for time series forecasting.
Q2B. Which of the following are limitations of using Impulse Response Functions(IRFs) in time series analysis?i. IRFs are only valid for linear time series models.ii. IRFs assume that the underlying time series is stationary.iii. IRFs can provide information about the short-term dynamics of the relationshipbetween variables, but they do not capture longer-term effects or otherimportant aspects of the relationship.iv. IRFs depend on the specification of the model used to estimate the relationshipbetween variables.
Chapter 5 Solutions
Managerial Economics: Applications, Strategies and Tactics (MindTap Course List)
Ch. 5 - The forecasting staff for the Prizer Corporation...Ch. 5 - Prob. 2ECh. 5 - Metropolitan Hospital has estimated its average...Ch. 5 - Prob. 4ECh. 5 - A firm experienced the demand shown in the...Ch. 5 - The economic analysis division of Mapco...Ch. 5 - The Questor Corporation has experienced the...Ch. 5 - Bell Greenhouses has estimated its monthly demand...Ch. 5 - Savings-Mart (a chain of discount department...Ch. 5 - Prob. 1.1CE
Ch. 5 - Plot the logarithm of arrivals for each...Ch. 5 - Logarithms are especially useful for comparing...Ch. 5 - Prob. 1.4CECh. 5 - In attempting to formulate a model of the...Ch. 5 - Estimate the double-log (log linear) time trend...Ch. 5 - Prob. 2.1CECh. 5 - Prob. 3.1CECh. 5 - Prob. 3.2CECh. 5 - Prob. 3.3CE
Knowledge Booster


Learn more about
Need a deep-dive on the concept behind this application? Look no further. Learn more about this topic, economics and related others by exploring similar questions and additional content below.Similar questions
- The forecasting staff for the Prizer Corporation has developed a model to predict sales of its air-cushioned-ride snowmobiles. The model specifies that sales S vary jointly with disposable personal income Y and the population between ages 15 and 40, Z, and inversely with the price of the snowmobiles P. Based on past data, the best estimate of this relationship is S=kYZP where k has been estimated (with past data) to equal 100. If Y=11,000,Z=1,200, and P=20,000, what value would you predict for S? What happens if P is reduced to $17,500? How would you go about developing a value for k? What are the potential weaknesses of this model?arrow_forwardSavings-Mart (a chain of discount department stores) sells patio and lawn furniture. Sales are seasonal, with higher sales during the spring and summer quarters and lower sales during the fall and winter quarters. The company developed the following quarterly sales forecasting model: Y t=8.25+0.125t2.75D1t+3.50D3t where Y t=predictedsales(million)inquartert 8.25=quarterlysales(million)whent=0 t=timeperiod(quarter)wherethefourthquarterof2002=0,firstquarterof2003=1,secondquarterof2003=2,... D1t={1forfirst-quarterobservations0otherwiseD2t={1forsecond-quarterobservations0otherwiseD3t={1forthird-quarterobservations0otherwise Forecast Savings-Marts sales of patio and lawn furniture for each quarter of 2010.arrow_forwardwhich sentences are correct? 1.Decomposition methods assume that the actual time series value at period t is a function of three components: trend, seasonal, and irregular. 2.Dummy variables can be used to deal with categorical independent variables in a multiple regression model. 3.If a time series exhibits a linear trend, the method of least squares may be used to determine a trend line (projection) for future forecasts. 4.Time series decomposition can be used to separate or decompose a time series into seasonal, trend, and irregular (error) components. 5.A variety of nonlinear functions can be used to develop an estimate of the trend in a time series, including quadratic trend equation and exponential trend equation. 6.Hypothesis Testing about the variances of Two Populations apply with F test Statistic. 7.Hypothesis Testing about the variances of One Populations apply with Chi test Statistic. 8.Hypothesis Testing about the variances of One Populations apply with F test Statistic.…arrow_forward
- What conditions must non-linear time series models, such as vector autoregressive models, satisfy in order to use impulse response functionsarrow_forwardA researcher has a sample of 6 annual observations {94, 104, 102, 99, 111 and 107} for the CPI in country Z for the period 2015 to 2020, and wants to forecast CPI for the years 2021, 2022 and 2023. The researcher uses 3 different forecasting models: A, B and C. Model A is an AR(1) model with no drift and with an estimated autoregressive coefficient = 0.7. Model B is a MA(1) model with no constant and with an estimated MA coefficient = -0.4 (note the minus !). Model C is a random walk model with no drift. The error terms over the 2015-2020 period were estimated to have the values: {3, -1, 2, 4, -3, 1}. a. Compute the 2021, 2022 and 2023 forecasted values for the consumer price index based on the three models. Show the formulas and the details of your calculations, and explain all the related symbols. b. Suppose that the actual values of the CPI over the 2021, 2022 and 2023 were {108, 114, 105}. Calculate the Root mean square error of the three model forecasts over the 2021-2023…arrow_forwardUsing the fixed-time period inventory model, and given an average daily demand of 287 units , 4 days between inventory reviews, 5 days for lead time, 141 units of inventory on hand, a "z" of 1.96, and a standard deviation of demand over the review and lead time of 2 units, which of the following is the order quantity?arrow_forward
- Based on annual data from 2000-2010, the Gadget Company estimates that sales are growing according to a linear trend: Q = 50,000 + 200t where t is time and t = 0 in 2000. a. Forecast sales for 2013. b. Do you see any problems with this forecasting method?arrow_forwardHistorical demand for Peeps is as displayed in the table. Month Demand January 11 February 18 March 31 April 39 May 44 June 53 July 67 August 82 September 96 Develop forecasts from June through October using these techniques: Holt's method with alpha=0.2 and beta=0.1. For Holt's model, the level and trend for May are assumed to be 44 and 12. Judge which forecast method is the best based on MAD.arrow_forwardThe Questor Corporation has experienced the following sales pattern over a 10-year period: Compute the equation of a trend line (similar to Equation 5.4) for these sales data to forecast sales for the next year. (Let 2004=0,2005=1, etc., for the time variable.) What does this equation forecast for sales in the year 2014? Use a first-order exponential smoothing model with a w of 0.9 to forecast sales for the year 2014.arrow_forward
- Bell Greenhouses has estimated its monthly demand for potting soil to be the following: N=400+4X where N=monthlydemandforbagsofpottingsoil X=timeperiodsinmonths(March2006=0) Assume this trend factor is expected to remain stable in the foreseeable future. The following table contains the monthly seasonal adjustment factors, which have been estimated using actual sales data from the past five years: Forecast Bell Greenhouses demand for potting soil in March, June, August, and December 2007. If the following table shows the forecasted and actual potting soil sales by Bell Greenhouses for April in five different years, determine the seasonal adjustment factor to be used in making an April 2008 forecast.arrow_forwardIn attempting to formulate a model of the passenger arrival data on cruise ships over time would a nonlinear (perhaps a multiplicative exponential) model be preferable to a linear model of cruise ship arrivals against time? What about in the case of the passenger arrivals by ferry against time?arrow_forwardIs it true of false that the classical errors in variables (CEV) assumption is that the measurement error is correlated with the unobserved true value of the explanatory variable.arrow_forward
arrow_back_ios
SEE MORE QUESTIONS
arrow_forward_ios
Recommended textbooks for you
 Managerial Economics: Applications, Strategies an...EconomicsISBN:9781305506381Author:James R. McGuigan, R. Charles Moyer, Frederick H.deB. HarrisPublisher:Cengage Learning
Managerial Economics: Applications, Strategies an...
Economics
ISBN:9781305506381
Author:James R. McGuigan, R. Charles Moyer, Frederick H.deB. Harris
Publisher:Cengage Learning
Forecasting: Exponential Smoothing, MSE; Author: Joshua Emmanuel;https://www.youtube.com/watch?v=k_HN0wOKDd0;License: Standard Youtube License