
Concept explainers
Videos
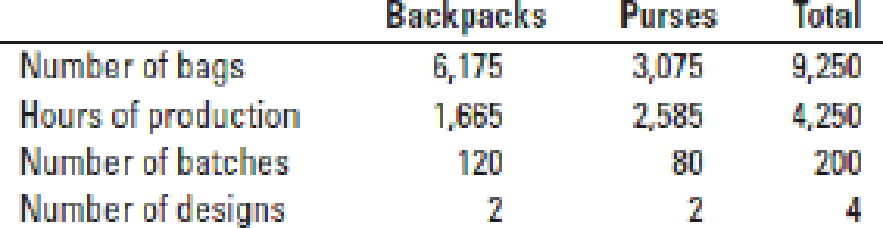
Choosing cost drivers, activity-based costing, activity-based management. Pastel Bags (PB) is a designer of high-quality backpacks and purses. Each design is made in small batches. Each spring, PB comes out with new designs for the backpack and for the purse. The company uses these designs for a year and then moves on to the next trend. The bags are all made on the same fabrication equipment that is expected to operate at capacity. The equipment must be switched over to a new design and set up to prepare for the production of each new batch of products. When completed, each batch of products is immediately shipped to a wholesaler. Shipping costs vary with the number of shipments. Budgeted information for the year is as follows:
| Pastel Bags Budget for Costs and Activities For the Year Ended February 28, 2017 | |
| Direct materials—purses | $ 319,155 |
| Direct materials—backpacks | 454,995 |
| Direct manufacturing labor—purses | 99,000 |
| Direct manufacturing labor—backpacks | 113,000 |
| Setup | 64,000 |
| Shipping | 73,000 |
| Design | 169,000 |
| Plant utilities and administration | 221,000 |
| Total | $1,513, 150 |
Other budget information follows:
Required
- 2. Identify the most appropriate cost driver for each cost category. Explain briefly your choice of cost driver.
- 3. Calculate the budgeted cost per unit of cost driver for each cost category.
- 4. Calculate the budgeted total costs and cost per unit for each product line.'
- 5. Explain how you could use the information in requirement 4 to reduce costs.

Learn your wayIncludes step-by-step video

Chapter 5 Solutions
CUSTOM COST ACCOUNTING 15E
Additional Business Textbook Solutions
Managerial Accounting (4th Edition)
Principles of Accounting Volume 1
Horngren's Financial & Managerial Accounting, The Financial Chapters (6th Edition)
Horngren's Accounting (11th Edition)
Construction Accounting And Financial Management (4th Edition)


- Shorts Manufacturing, Inc., has implemented lean manufacturing in its Kansas City plant as a pilot program. One of its value streams produces a family of small electric tools. The value-stream team managers were quite excited about the results, as some of their efforts to eliminate waste were proving to be effective. During the most recent three weeks, the following data pertaining to the electric tool value stream were collected: Week 1: Demand = 90 units @ 40 Beginning inventory = 10 units @ 20 (5 materials and 15 conversion) Production = 90 units using 450 of material and 1,350 of conversion cost Week 2: Demand = 100 units @ 40 Beginning inventory = 10 units @ 20 (5 materials and 15 conversion) Production = 90 units using 450 of material and 1,350 of conversion cost Week 3: Demand = 90 units @ 40 Beginning inventory = 0 Production = 100 units using 500 of material and 1,500 of conversion cost Required: 1. Prepare a traditional income statement for each week. 2. Calculate the average value-stream product cost for each week. What does this cost signal, if anything? 3. Prepare a value-stream income statement for each week. Assume that any increase in inventory is valued at average cost. Comment on the financial performance of the value stream and its relationship to traditional income measurement.arrow_forwardJolene Askew, manager of Feagan Company, has committed her company to a strategically sound cost reduction program. Emphasizing life-cycle cost management is a major part of this effort. Jolene is convinced that production costs can be reduced by paying more attention to the relationships between design and manufacturing. Design engineers need to know what causes manufacturing costs. She instructed her controller to develop a manufacturing cost formula for a newly proposed product. Marketing had already projected sales of 25,000 units for the new product. (The life cycle was estimated to be 18 months. The company expected to have 50 percent of the market and priced its product to achieve this goal.) The projected selling price was 20 per unit. The following cost formula was developed: Y=200,000+10X1 where X1=Machinehours(Theproductisexpectedtouseonemachinehourforeveryunitproduced.) Upon seeing the cost formula, Jolene quickly calculated the projected gross profit to be 50,000. This produced a gross profit of 2 per unit, well below the targeted gross profit of 4 per unit. Jolene then sent a memo to the Engineering Department, instructing them to search for a new design that would lower the costs of production by at least 50,000 so that the target profit could be met. Within two days, the Engineering Department proposed a new design that would reduce unit-variable cost from 10 per machine hour to 8 per machine hour (Design Z). The chief engineer, upon reviewing the design, questioned the validity of the controllers cost formula. He suggested a more careful assessment of the proposed designs effect on activities other than machining. Based on this suggestion, the following revised cost formula was developed. This cost formula reflected the cost relationships of the most recent design (Design Z). Y=140,000+8X1+5,000X2+2,000X3 where X1=MachinehoursX2=NumberofbatchesX3=Numberofengineeringchangeorders Based on scheduling and inventory considerations, the product would be produced in batches of 1,000; thus, 25 batches would be needed over the products life cycle. Furthermore, based on past experience, the product would likely generate about 20 engineering change orders. This new insight into the linkage of the product with its underlying activities led to a different design (Design W). This second design also lowered the unit-level cost by 2 per unit but decreased the number of design support requirements from 20 orders to 10 orders. Attention was also given to the setup activity, and the design engineer assigned to the product created a design that reduced setup time and lowered variable setup costs from 5,000 to 3,000 per setup. Furthermore, Design W also creates excess activity capacity for the setup activity, and resource spending for setup activity capacity can be decreased by 40,000, reducing the fixed cost component in the equation by this amount. Design W was recommended and accepted. As prototypes of the design were tested, an additional benefit emerged. Based on test results, the post-purchase costs dropped from an estimated 0.70 per unit sold to 0.40 per unit sold. Using this information, the Marketing Department revised the projected market share upward from 50 percent to 60 percent (with no price decrease). Required: 1. Calculate the expected gross profit per unit for Design Z using the controllers original cost formula. According to this outcome, does Design Z reach the targeted unit profit? Repeat, using the engineers revised cost formula. Explain why Design Z failed to meet the targeted profit. What does this say about the use of unit-based costing for life-cycle cost management? 2. Calculate the expected profit per unit using Design W. Comment on the value of activity information for life-cycle cost management. 3. The benefit of the post-purchase cost reduction of Design W was discovered in testing. What direct benefit did it create for Feagan Company (in dollars)? Reducing post-purchase costs was not a specific design objective. Should it have been? Are there any other design objectives that should have been considered?arrow_forwardBumblebee Mobiles manufactures a line of cell phones. The management has identified the following overhead costs and related cost drivers for the coming year. The following were incurred in manufacturing two of their cell phones, Bubble and Burst, during the first quarter. REQUIREMENT Review the worksheet called ABC that follows these requirements. You have been asked to determine the cost of each product using an activity-based cost system. Note that the problem information is already entered into the Data Section of the ABC worksheet.arrow_forward
- A local picnic table manufacturer has budgeted these overhead costs: They are considering adapting ABC costing and have estimated the cost drivers for each pool as shown: Recent success has yielded an order for 1,000 tables. Assume direct labor costs per hour of $20. Determine how much the job would cost given the following activities:arrow_forwardAssume that at the beginning of 20x2, Cicleta trained the 2 assembly workers in a new approach that had the objective of increasing the efficiency of the assembly process. Cicleta also began moving toward a JIT purchasing and manufacturing system. When JIT is fully implemented, the demand for expediting is expected to be virtually eliminated. It is expected to take two to three years for full implementation. Assume that receiving cost is a step-fixed cost with steps of 1,500 orders. The other three activities employ resources that are acquired as used and needed. At the end of 20x2, the following results were reported for the four activities: Required: 1. Prepare a trend report that shows the non-value-added costs for each activity for 20x1 and 20x2 and the change in costs for the two periods. Discuss the reports implications. 2. Explain the role of activity reduction for receiving and for expediting. What is the expected value of SQ for each activity after JIT is fully implemented? 3. What if at the end of 20x2, the selling price of a competing product is reduced by 27 per unit? Assume that the firm produces and sells 20,000 units of its product and that its product is associated only with the four activities being considered. By virtue of the waste-reduction savings, can the competitors price reduction be matched without reducing the unit profit margin of the product that prevailed at the beginning of the year? If not, how much more waste reduction is needed to achieve this outcome? In this case, what price decision would you recommend?arrow_forwardDeMarco Company is developing a cost formula for its packing activity. Discussion with the workers in the Packing Department has revealed that packing costs are associated with the number of customer orders, the size of the orders, and the relative fragility of the items (more fragile items must be specially wrapped in bubble wrap and Styrofoam). Data for the past 20 months have been gathered: Required: 1. Using the method of least squares, run a regression using the number of orders as the independent variable. 2. Run a multiple regression using three independent variables: the number of orders, the weight of orders, and the number of fragile items. Which regression equation is better? Why? 3. Predict the total packing cost for 25,000 orders, weighing 40,000 pounds, with 4,000 fragile items.arrow_forward
- The Calhoun Textile Mill is in the process of deciding on a production schedule. It wishes to know how to weave the various fabrics it will produce during the coming quarter. The sales department has continued orders for each of the 15 fabrics produced by Calhoun. These demands are given in the following table. Also given in this table is the variable cost for each fabric. The mill operates continuously during the quarter: 13 weeks, 7 days a week, and 24 hours a day. There are two types of looms: dobbie and regular. Dobbie looms can be used to make all fabrics and are the only looms that can weave certain fabrics, such as plaids. The rate of production for each fabric on each type of loom is also given in the table. Note that if the production rate is zero, the fabric cannot be woven on that type of loom. Also, if a fabric can be woven on each type of loom, then the production rates are equal. Calhoun has 90 regular looms and 15 dobbie looms. For this problem, assume that the time requirement to change over a loom from one fabric to another is negligible. Management would like to know how to allocate the looms to the fabrics and which fabrics to buy on the market so as to minimize the cost of meeting demand.arrow_forwardGumbrecht Company has the following departmental manufacturing layout for one of its plants: A consulting firm has recommended a value stream with the following manufacturing cell: Required: 1. Calculate the total time it takes to produce a batch of 20 units using the traditional departmental manufacturing layout. 2. Using cellular manufacturing, how much time is saved producing the same batch of 20 units? Assuming the cell operates continuously, what is the production rate? Which process controls this production rate? 3. Assume the processing time of Casting is reduced to 9 minutes, while the times of the other processes stay the same. What is the production rate now, and how long will it take to produce a batch of 20 units if the cell is in a continuous production mode?arrow_forwardEvans, Inc., has a unit-based costing system. Evanss Miami plant produces 10 different electronic products. The demand for each product is about the same. Although they differ in complexity, each product uses about the same labor time and materials. The plant has used direct labor hours for years to assign overhead to products. To help design engineers understand the assumed cost relationships, the Cost Accounting Department developed the following cost equation. (The equation describes the relationship between total manufacturing costs and direct labor hours; the equation is supported by a coefficient of determination of 60 percent.) Y=5,000,000+30X,whereX=directlaborhours The variable rate of 30 is broken down as follows: Because of competitive pressures, product engineering was given the charge to redesign products to reduce the total cost of manufacturing. Using the above cost relationships, product engineering adopted the strategy of redesigning to reduce direct labor content. As each design was completed, an engineering change order was cut, triggering a series of events such as design approval, vendor selection, bill of materials update, redrawing of schematic, test runs, changes in setup procedures, development of new inspection procedures, and so on. After one year of design changes, the normal volume of direct labor was reduced from 250,000 hours to 200,000 hours, with the same number of products being produced. Although each product differs in its labor content, the redesign efforts reduced the labor content for all products. On average, the labor content per unit of product dropped from 1.25 hours per unit to one hour per unit. Fixed overhead, however, increased from 5,000,000 to 6,600,000 per year. Suppose that a consultant was hired to explain the increase in fixed overhead costs. The consultants study revealed that the 30 per hour rate captured the unit-level variable costs; however, the cost behavior of other activities was quite different. For example, setting up equipment is a step-fixed cost, where each step is 2,000 setup hours, costing 90,000. The study also revealed that the cost of receiving goods is a function of the number of different components. This activity has a variable cost of 2,000 per component type and a fixed cost that follows a step-cost pattern. The step is defined by 20 components with a cost of 50,000 per step. Assume also that the consultant indicated that the design adopted by the engineers increased the demand for setups from 20,000 setup hours to 40,000 setup hours and the number of different components from 100 to 250. The demand for other non-unit-level activities remained unchanged. The consultant also recommended that management take a look at a rejected design for its products. This rejected design increased direct labor content from 250,000 hours to 260,000 hours, decreased the demand for setups from 20,000 hours to 10,000 hours, and decreased the demand for purchasing from 100 component types to 75 component types, while the demand for all other activities remained unchanged. Required: 1. Using normal volume, compute the manufacturing cost per labor hour before the year of design changes. What is the cost per unit of an average product? 2. Using normal volume after the one year of design changes, compute the manufacturing cost per hour. What is the cost per unit of an average product? 3. Before considering the consultants study, what do you think is the most likely explanation for the failure of the design changes to reduce manufacturing costs? Now use the information from the consultants study to explain the increase in the average cost per unit of product. What changes would you suggest to improve Evanss efforts to reduce costs? 4. Explain why the consultant recommended a second look at a rejected design. Provide computational support. What does this tell you about the strategic importance of cost management?arrow_forward
- Kagle design engineers are in the process of developing a new green product, one that will significantly reduce impact on the environment and yet still provide the desired customer functionality. Currently, two designs are being considered. The manager of Kagle has told the engineers that the cost for the new product cannot exceed 550 per unit (target cost). In the past, the Cost Accounting Department has given estimated costs using a unit-based system. At the request of the Engineering Department, Cost Accounting is providing both unit-and activity-based accounting information (made possible by a recent pilot study producing the activity-based data). Unit-based system: Variable conversion activity rate: 100 per direct labor hour Material usage rate: 20 per part ABC system: Labor usage: 15 per direct labor hour Material usage (direct materials): 20 per part Machining: 75 per machine hour Purchasing activity: 150 per purchase order Setup activity: 3,000 per setup hour Warranty activity: 500 per returned unit (usually requires extensive rework) Customer repair cost: 25 per repair hour (average) Required: 1. Select the lower-cost design using unit-based costing. Are logistical and post-purchase activities considered in this analysis? 2. Select the lower-cost design using ABC analysis. Explain why the analysis differs from the unit-based analysis. 3. What if the post-purchase cost was an environmental contaminant and amounted to 10 per unit for Design A and 40 per unit for Design B? Assume that the environmental cost is borne by society. Now which is the better design?arrow_forwardPumpkin Bags (PB) is a designer of high-quality backpacks and purses. Each design is made in small batches. Each spring, PB comes out with new designs for the backpack and for the purse. They use these designs for one year and then move on to the next trend. The bags are all made on the same fabrication equipment that is expected to operate at capacity. The equipment must be switched over to a new design and set up to prepare for the production of each new batch of products. When completed, each batch of products is immediately shipped to a wholesaler. Shipping costs vary with the number of shipments. Budgeted information for the year is as follows: Required 1. Calculate the cost per unit of cost driver for each cost category. 2. Calculate the total costs and cost per unit for each product line. 3. Explain how you could use the information in requirement 4 to reduce costs.arrow_forwardAfter reviewing the new activity-based costing system that Nancy Chen has implemented at IVC's CenterPoint manufacturing facility, Tom Spencer, the production supervisor, believes that he can reduce production costs by reducing the time spent on machine setups. He has spent the last month working with employees in the plant to change over the machines more quickly with the same reliability. He plans to produce 109,000 units of the Sport model and 44,500 units of the Pro model in the first quarter. He believes that with his more efficient setup routine, he can reduce the number of setup hours for both the Sport and the Pro products by one-third. Cost Drivers and Cost Driver Volumes—CenterPoint Manufacturing Facility Activity Cost Driver Cost Driver Volume Sport Pro Total Assembly building Assembling Machine-hours 6,900 30,900 37,800 Setting up machines Setup hours 49 490 539 Handling material Production runs 17 49 66 Packaging building Inspecting and…arrow_forward
 Managerial AccountingAccountingISBN:9781337912020Author:Carl Warren, Ph.d. Cma William B. TaylerPublisher:South-Western College Pub
 Excel Applications for Accounting PrinciplesAccountingISBN:9781111581565Author:Gaylord N. SmithPublisher:Cengage Learning
 Cornerstones of Cost Management (Cornerstones Ser...AccountingISBN:9781305970663Author:Don R. Hansen, Maryanne M. MowenPublisher:Cengage Learning
 Essentials of Business Analytics (MindTap Course ...StatisticsISBN:9781305627734Author:Jeffrey D. Camm, James J. Cochran, Michael J. Fry, Jeffrey W. Ohlmann, David R. AndersonPublisher:Cengage Learning
 Managerial Accounting: The Cornerstone of Busines...AccountingISBN:9781337115773Author:Maryanne M. Mowen, Don R. Hansen, Dan L. HeitgerPublisher:Cengage Learning
 Principles of Accounting Volume 2AccountingISBN:9781947172609Author:OpenStaxPublisher:OpenStax College