
Concept explainers
Videos
Interpretation of Regression Results: Simple Regression Using a Spreadsheet
Hartman Company’s Lucas plant manufactures thermostatic controls. Plant management has experienced fluctuating monthly
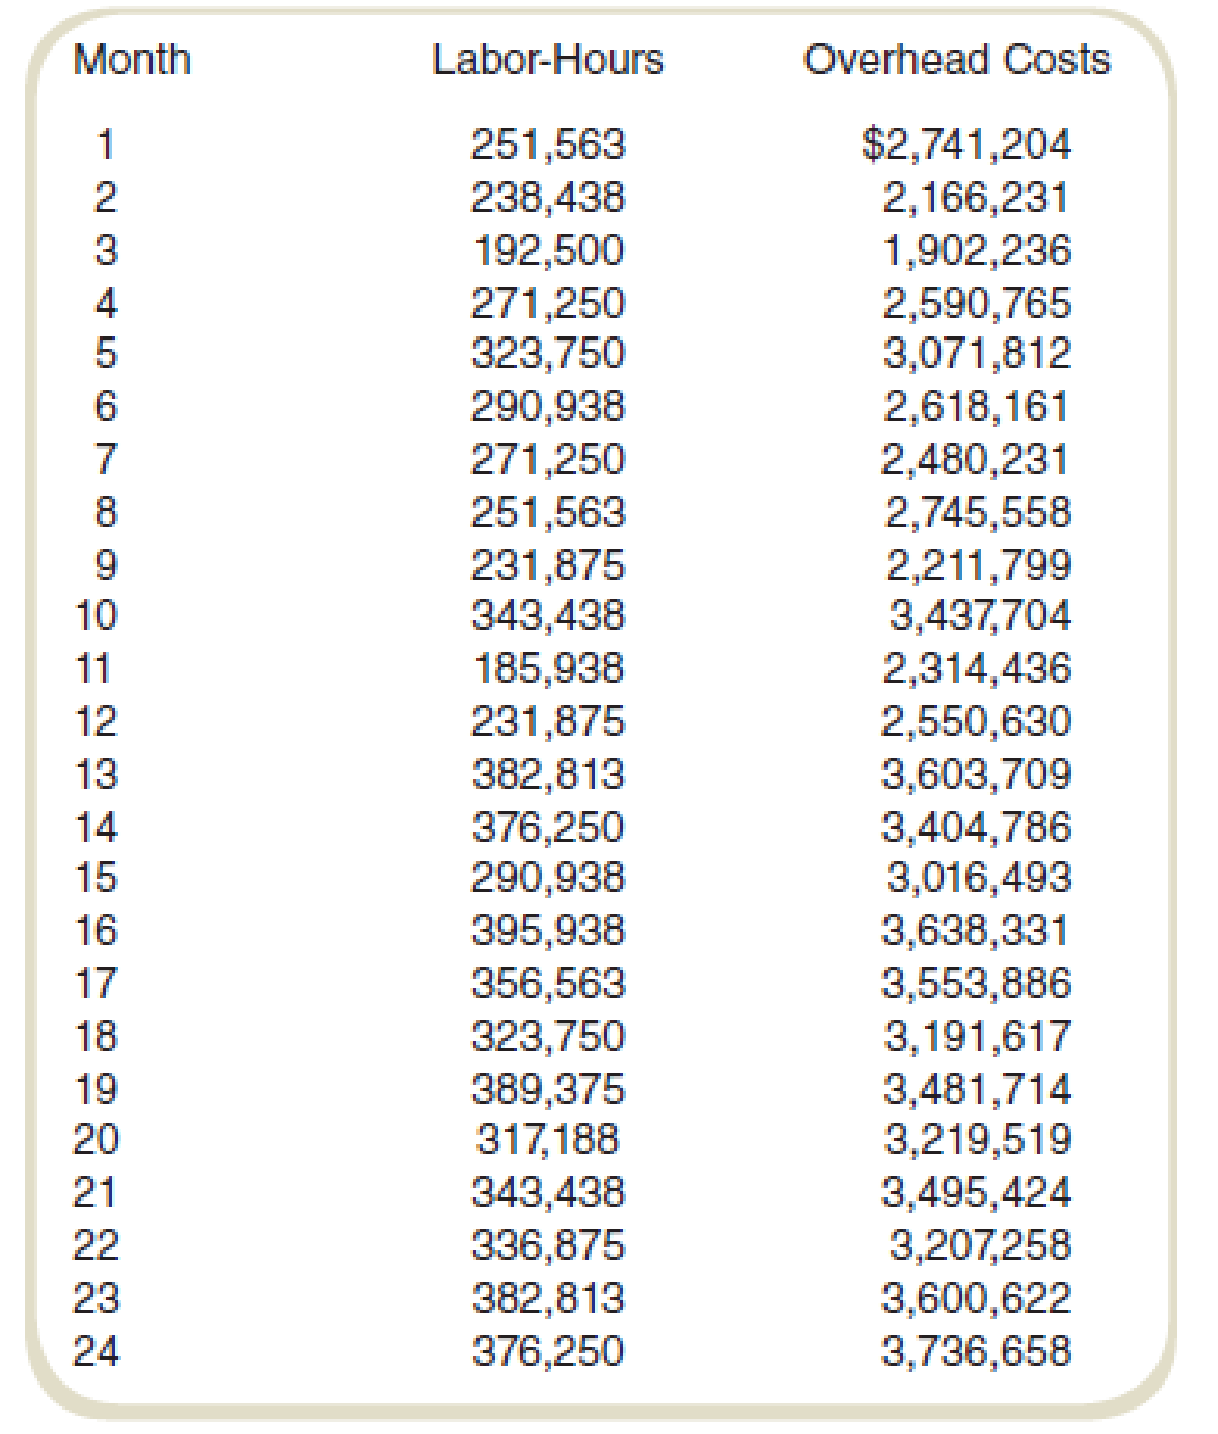
A member of the controller’s staff proposed that the behavior pattern of these overhead costs be determined to improve cost estimation. Another staff member suggested that a good starting place for determining cost behavior patterns is to analyze historical data. Following this suggestion, monthly data were gathered on labor-hours and overhead costs for the past two years. No major changes in operations occurred over this period of time. The data are shown in the following table:
Required
- a. Use the high-low estimation method to estimate the overhead cost behavior (fixed and variable portions components of cost) for the Lucas plant.
- b. Prepare a scattergraph showing the overhead costs plotted against the labor-hours.
- c. Use a spreadsheet program to compute regression coefficients to describe the overhead cost equation.
- d. Use the results of your regression analysis to develop an estimate of overhead costs assuming 350,000 labor-hours will be worked next month.
a.
Estimate the monthly fixed costs and the unit variable cost per machine-hour using the high-low estimation method.
Explanation of Solution
High-low cost method:
High-low cost method helps in separating the fixed and variable cost from the total cost. It is calculated by comparing the highest and lowest level of activities and the cost of these activities.
Show the cost equation of fixed and variable cost with the overhead cost:
Thus, the cost equation is
Working note 1:
Calculate the fixed cost:
Calculate the highest and lowest activity:
| Particular | Labor hours | Overhead costs |
| Highest activity | 395,938 | $3,638,331 |
| Lowest activity | 185,938 | $2,314,436 |
Table: (1)
Working note 2:
Calculate the variable cost (unit) with the help of high-low cost method:
Working note 3:
Calculate the variable cost ($) with the help of high-low cost method:
b.
Draw a scatter graph relating call center costs to the number of support calls.
Explanation of Solution
Scatter graph:
Scatter graph shows the relationship between the cost and the activity. It shows the cost at various level of activity. It helps in finding the outlier in the data. So the management can eliminate it to make more effective decisions
Prepare a scatter graph for overhead cost and labor hours:
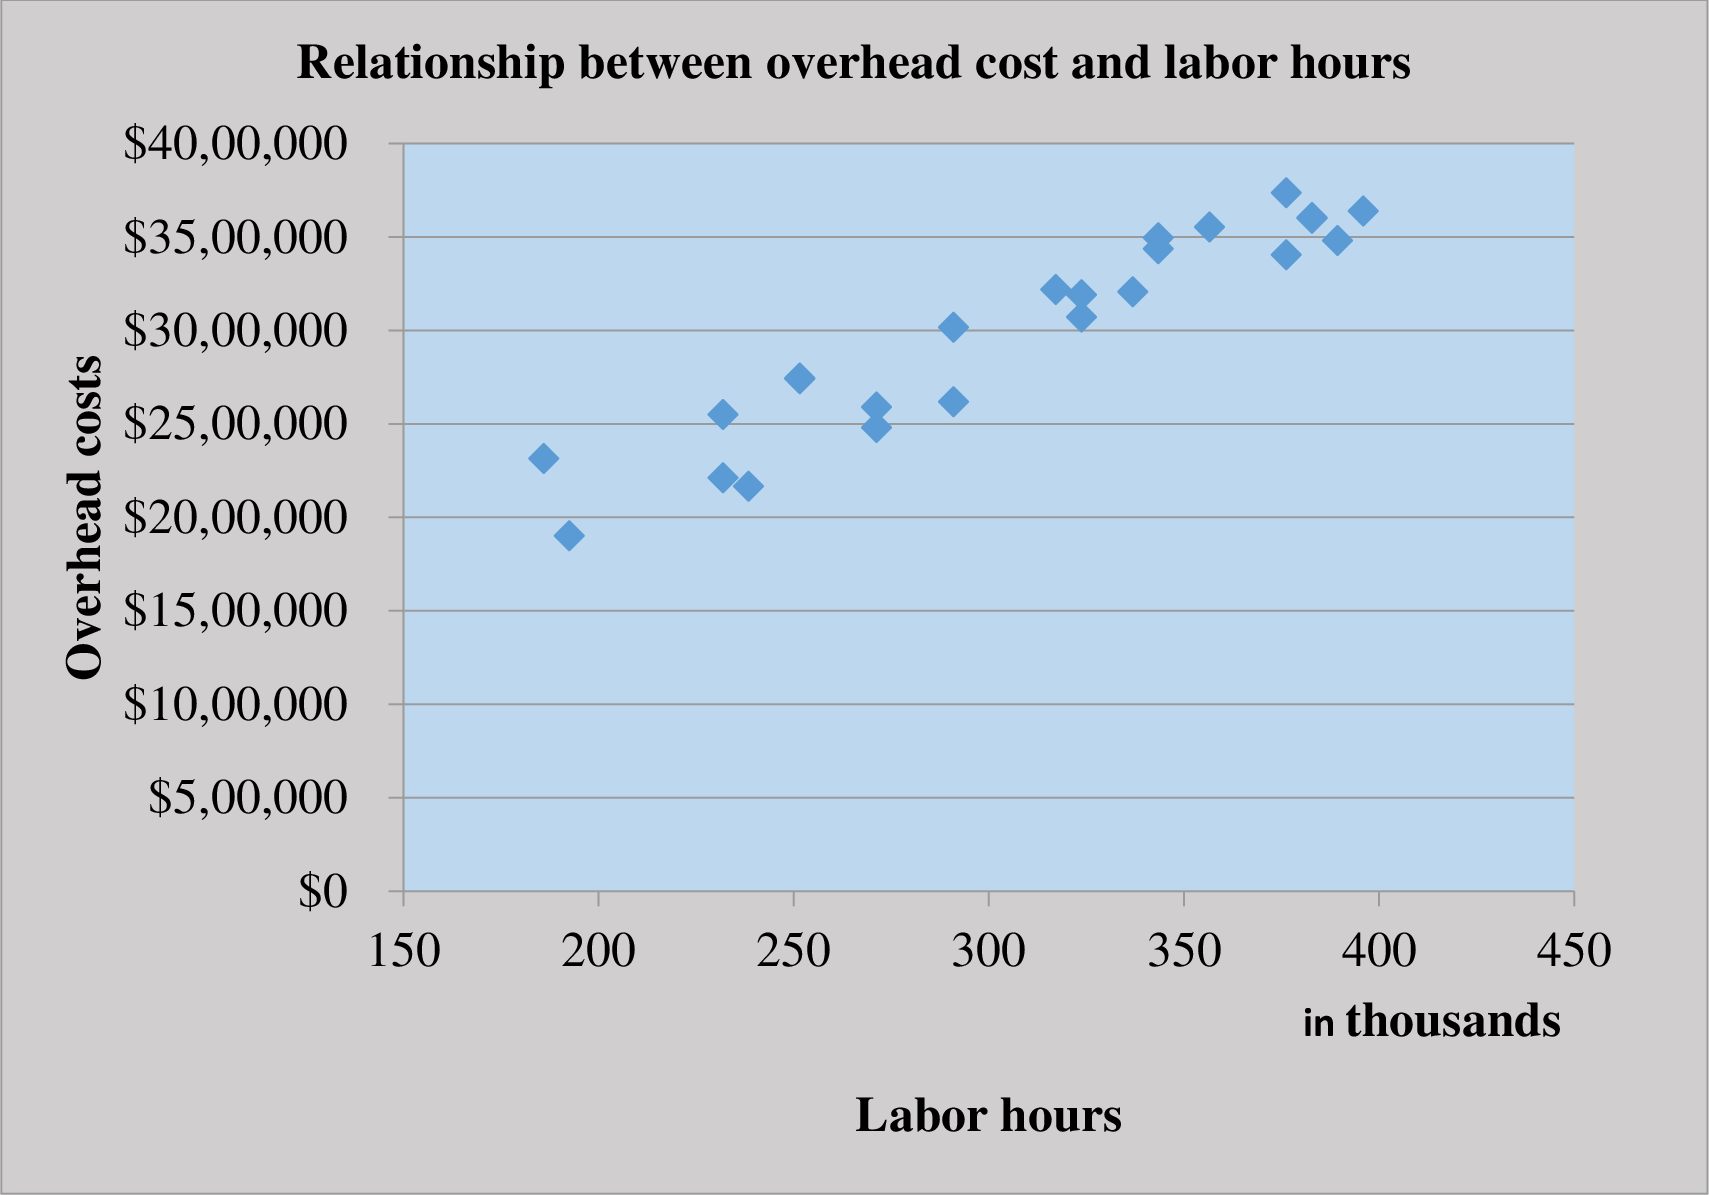
The scatter plot represents labor hours on the horizontal axis and the overhead costs on the vertical axis.
c.
Use a spreadsheet program to compute regression coefficients to describe the overhead cost equation.
Explanation of Solution
Cost equation:
Cost equation is a mathematical representation of the cost estimation at various level of activity. It is used by defining the fixed cost, and variable cost per unit and then the variable cost per unit is multiplied by the given variable to calculate the relative cost.
Calculate the overhead cost equation with the help of regression coefficients:
| Regression Statistics | ||||||||
| Multiple R | 0.94878 | |||||||
| R Square | 0.900184 | |||||||
| Adjusted R Square | 0.895647 | |||||||
| Standard Error | 176381.9 | |||||||
| Observations | 24 | |||||||
| ANOVA | ||||||||
| df | SS | MS | F | Significance F | ||||
| Regression | 1 | 6.17E+12 | 6.17E+12 | 198.4054 | 1.73E-12 | |||
| Residual | 22 | 6.84E+11 | 3.11E+10 | |||||
| Total | 23 | 6.86E+12 | ||||||
| Coefficients | Standard Error | t Stat | P-value | Lower 95% | Upper 95% | Lower 95.0% | Upper 95.0% | |
| Intercept | 533857.1 | 178689.9 | 2.987618 | 0.006786 | 163277 | 904437.3 | 163277 | 904437.3 |
| X Variable 1 | 8.042909 | 0.571 | 14.08565 | 1.73E-12 | 6.858726 | 9.227091 | 6.858726 | 9.227091 |
Table: (2)
The regression analysis of the company provides the following details:
Calculate the cost equation:
Put the values in the cost equation:
Thus, the overhead cost is:
d.
Use the results of your regression analysis to develop an estimate of overhead costs assuming 350,000 labor-hours will be worked next month.
Answer to Problem 60P
The overhead cost is $3,347,857.
Explanation of Solution
Regression analysis:
Regression analysis is used to show the relationship between the cost and the activity. It is used to estimate the cost at various level of activity.
The most important step in the calculation of regression analysis is to establish a logical relationship between the cost and the activity. The activity (independent variable) is placed on the right-hand side, and the cost (dependent variable) is placed on the left-hand side of the graph.
Calculate the overhead cost:
Thus, the overhead cost is $3,347,857.
Want to see more full solutions like this?
Chapter 5 Solutions
Gen Combo Fundamentals Of Cost Accounting; Connect Access Card


- Pareto chart and cost of quality report for a manufacturing company The president of Mission Inc. has been concerned about the growth in costs over the last several years. The president asked the controller to perform an activity analysis to gain a better insight into these costs. The activity analysis revealed the following: The production process is complicated by quality problems, requiring the production manager to expedite production and dispose of scrap. Instructions 1. Prepare a Pareto chart of the company activities. 2. Classify the activities into prevention, appraisal, internal failure, external failure, and not costs of quality (producing product). Classify the activities into value-added and non-value-added activities. 3. Use the activity cost information to determine the percentages of total costs that are prevention, appraisal, internal failure, external failure, and not costs of quality. 4. Determine the percentages of total costs that are value-added and non-value-added. 5. Interpret the information.arrow_forwardThe management of Wheeler Company has decided to develop cost formulas for its major overhead activities. Wheeler uses a highly automated manufacturing process, and power costs are a significant manufacturing cost. Cost analysts have decided that power costs are mixed; thus, they must be broken into their fixed and variable elements so that the cost behavior of the power usage activity can be properly described. Machine hours have been selected as the activity driver for power costs. The following data for the past eight quarters have been collected: Required: 1. Prepare a scattergraph by plotting power costs against machine hours. Does the scatter-graph show a linear relationship between machine hours and power cost? 2. Using the high and low points, compute a power cost formula. 3. Use the method of least squares to compute a power cost formula. Evaluate the coefficient of determination. 4. Rerun the regression and drop the point (20,000; 26,000) as an outlier. Compare the results from this regression to those for the regression in Requirement 3. Which is better?arrow_forwardMethod of Least Squares, Predicting Cost for Different Time Periods from the One Used to Develop a Cost Formula Refer to the information for Farnsworth Company on the previous page. However, assume that Tracy has used the method of least squares on the receiving data and has gotten the following results: Required: 1. Using the results from the method of least squares, prepare a cost formula for the receiving activity. 2. Using the formula from Requirement 1, what is the predicted cost of receiving for a month in which 1,450 receiving orders are processed? (Note: Round your answer to the nearest dollar.) 3. Prepare a cost formula for the receiving activity for a quarter. Based on this formula, what is the predicted cost of receiving for a quarter in which 4,650 receiving orders are anticipated? Prepare a cost formula for the receiving activity for a year. Based on this formula, what is the predicted cost of receiving for a year in which 18,000 receiving orders are anticipated?arrow_forward
- (Appendix 3A) Method of Least Squares Using Computer Spreadsheet Program The controller for Beckham Company believes that the number of direct labor hours is associated with overhead cost. He collected the following data on the number of direct labor hours and associated factory overhead cost for the months of January through August. Required: 1. Using a computer spreadsheet program such as Excel, run a regression on these data. Print out your results. 2. Using your results from Requirement 1, write the cost formula for overhead cost. (Note: Round the fixed cost to the nearest dollar and the variable rate to the nearest cent.) 3. CONCEPTUAL CONNECTION What is R2 based on your results? Do you think that the number of direct labor hours is a good predictor of factory overhead cost? 4. Assuming that expected September direct labor hours are 700, what is expected factory overhead cost using the cost formula in Requirement 2?arrow_forwardCommunications Jamarcus Bradshaw, plant manager of Georgia Paper Companys papermaking mill, was looking over the cost of production reports for July and August for the Papermaking Department. The reports revealed the following: Jamarcus was concerned about the increased cost per ton from the output of the department. As a result, he asked the plant controller to perform a study to help explain these results. The controller, Leann Brunswick, began the analysis by performing some interviews of key plant personnel in order to understand what the problem might be. Excerpts from an interview with Len Tyson, a paper machine operator, follow: Len: We have two papermaking machines in the department. I have no data, but I think paper machine No. 1 is applying too much pulp and, thus, is wasting both conversion and materials resources. We haven't had repairs on paper machine No. 1 in a while. Maybe this is the problem. Leann: How does too much pulp result in wasted resources? Len: Well, you see, if too much pulp is applied, then we will waste pulp material. The customer will not pay for the extra product; we just use more material to make the product. Also, when there is too much pulp, the machine must be slowed down in order to complete the drying process. This results in additional conversion costs. Leann: Do you have any other suspicions? Len: Well, as you know, we have two productsgreen paper and yellow paper. They are identical except for the color. The color is added to the papermaking process in the paper machine. I think that during August these two color papers have been behaving very differently. I don't have any data, but it just seems as though the amount of waste associated with the green paper has increased. Leann: Why is this? Len: I understand that there has been a change in specifications for the green paper, starting near the beginning of August. This change could be causing the machines to run poorly when making green paper. If this is the case, the cost per ton would increase for green paper. Leann also asked for a database printout providing greater detail on Augusts operating results. September 9 Requested by: Leann Brunswick Papermaking DepartmentAugust detail Prior to preparing a report, Leann resigned from Georgia Paper Company to start her own business. You have been asked to take the data that Leann collected, and write a memo to Jamarcus Bradshaw with a recommendation to management. Your memo should include analysis of the August data to determine whether the paper machine or the paper color explains the increase in the unit cost from July. Include any supporting schedules that are appropriate. Round any calculations to the nearest cent.arrow_forwardScattergraph, High-Low Method, and Predicting Cost for a Different Time Period from the One Used to Develop a Cost Formula Refer to the information for Farnsworth Company on the previous page. Required: 1. Prepare a scattergraph based on the 10 months of data. Does the relationship appear to be linear? 2. Using the high-low method, prepare a cost formula for the receiving activity. Using this formula, what is the predicted cost of receiving for a month in which 1,450 receiving orders are processed? 3. Prepare a cost formula for the receiving activity for a quarter. Based on this formula, what is the predicted cost of receiving for a quarter in which 4,650 receiving orders are anticipated? Prepare a cost formula for the receiving activity for a year. Based on this formula, what is the predicted cost of receiving for a year in which 18,000 receiving orders are anticipated? Use the following information for Problems 3-60 and 3-61: Farnsworth Company has gathered data on its overhead activities and associated costs for the past 10 months. Tracy Heppler, a member of the controllers department, has convinced management that overhead costs can be better estimated and controlled if the fixed and variable components of each overhead activity are known. One such activity is receiving raw materials (unloading incoming goods, counting goods, and inspecting goods), which she believes is driven by the number of receiving orders. Ten months of data have been gathered for the receiving activity and are as follows:arrow_forward
- Using the data in P4-2 and Microsoft Excel: 1. Separate the variable and fixed elements. 2. Determine the cost to be charged to the product for the year. 3. Determine the cost to be charged to factory overhead for the year. 4. Determine the plotted data points using Chart Wizard. 5. Determine R2. 6. How do these solutions compare to the solutions in P4-2 and P4-3? 7. What does R2 tell you about this cost model?arrow_forwardThe management of Hartman Company is trying to determine the amount of each of two products to produce over the coming planning period. The following information concerns labor availability, labor utilization, and product profitability: a. Develop a linear programming model of the Hartman Company problem. Solve the model to determine the optimal production quantities of products 1 and 2. b. In computing the profit contribution per unit, management does not deduct labor costs because they are considered fixed for the upcoming planning period. However, suppose that overtime can be scheduled in some of the departments. Which departments would you recommend scheduling for overtime? How much would you be willing to pay per hour of overtime in each department? c. Suppose that 10, 6, and 8 hours of overtime may be scheduled in departments A, B, and C, respectively. The cost per hour of overtime is 18 in department A, 22.50 in department B, and 12 in department C. Formulate a linear programming model that can be used to determine the optimal production quantities if overtime is made available. What are the optimal production quantities, and what is the revised total contribution to profit? How much overtime do you recommend using in each department? What is the increase in the total contribution to profit if overtime is used?arrow_forwardEthics in Action In August, Lannister Company introduced a new performance measurement system in manufacturing operations. One of the new performance measures is lead time, which is determined by tagging a random sample of items with a log sheet throughout the month. The log sheets recorded the time that the sample items started production and the time that they ended production, as well as all steps in between. At the end of the month, the controller collected the log sheets and computed the average lead time of the tagged products. This number was reported to central management and was used to evaluate the performance of the plant manager. Because of the poor lead time results reported for August, the plant was under extreme pressure to reduce lead time in September. The following memo was intercepted by the controller. Date: September 3 To: Hourly Employees From: Plant Manager During last month, you may have noticed that some of the products were tagged with a log sheet. This sheet records the time that a product enters production and the time that it leaves production. The difference between these two times is termed the lead time. Our plant is evaluated on improving lead time. From now on, I ask all of you to keep an eye out for the tagged items. When you see a tagged item, it is to receive special attention. Work on that item first, and then immediately move it to the next operation. Under no circumstances should tagged items wait on any other work that you have. Naturally, report accurate information. I insist that you record the correct times on the log sheet as the product goes through your operations. How should the controller respond to this discovery?arrow_forward
- The controller for Muir Companys Salem plant is analyzing overhead in order to determine appropriate drivers for use in flexible budgeting. She decided to concentrate on the past 12 months since that time period was one in which there was little important change in technology, product lines, and so on. Data on overhead costs, number of machine hours, number of setups, and number of purchase orders are in the following table. Required: 1. Calculate an overhead rate based on machine hours using the total overhead cost and total machine hours. (Round the overhead rate to the nearest cent and predicted overhead to the nearest dollar.) Use this rate to predict overhead for each of the 12 months. 2. Run a regression equation using only machine hours as the independent variable. Prepare a flexible budget for overhead for the 12 months using the results of this regression equation. (Round the intercept and x-coefficient to the nearest cent and predicted overhead to the nearest dollar.) Is this flexible budget better than the budget in Requirement 1? Why or why not?arrow_forwardThe controller of the South Charleston plant of Ravinia, Inc., monitored activities associated with materials handling costs. The high and low levels of resource usage occurred in September and March for three different resources associated with materials handling. The number of moves is the driver. The total costs of the three resources and the activity output, as measured by moves for the two different levels, are presented as follows: Required: 1. Determine the cost behavior formula of each resource. Use the high-low method to assess the fixed and variable components. 2. Using your knowledge of cost behavior, predict the cost of each item for an activity output level of 9,000 moves. 3. Construct a cost formula that can be used to predict the total cost of the three resources combined. Using this formula, predict the total materials handling cost if activity output is 9,000 moves. In general, when can cost formulas be combined to form a single cost formula?arrow_forwardCommunication The controller of New Wave Sounds Inc. prepared the following product profitability report for management, using activity-based costing methods for allocating both the factory overhead and the marketing expenses. As such, the controller has confidence in the accuracy of this report. In addition, the controller interviewed the vice president of marketing, who provided the following insight into the companys three products: The home theater speakers are an older product that is highly recognized in the marketplace. The wireless speakers are a new product that was just recently launched. The wireless headphones are a new technology that has no competition in the marketplace, and it is hoped that they will become an important future addition to the companys product portfolio. Initial indications are that the product is well received by customers. The controller believes that the manufacturing costs for all three products are in line with expectations. Based on the information provided: 1. Calculate the ratio of gross profit to sales and the ratio of operating income to sales for each product. 2. Write a brief (one-page) memo using the product profitability report and the calculations in (a) to make recommendations to management with respect to strategies for the three products.arrow_forward
 Managerial AccountingAccountingISBN:9781337912020Author:Carl Warren, Ph.d. Cma William B. TaylerPublisher:South-Western College Pub
 Financial And Managerial AccountingAccountingISBN:9781337902663Author:WARREN, Carl S.Publisher:Cengage Learning,
 Cornerstones of Cost Management (Cornerstones Ser...AccountingISBN:9781305970663Author:Don R. Hansen, Maryanne M. MowenPublisher:Cengage Learning
 Managerial Accounting: The Cornerstone of Busines...AccountingISBN:9781337115773Author:Maryanne M. Mowen, Don R. Hansen, Dan L. HeitgerPublisher:Cengage Learning
 Essentials of Business Analytics (MindTap Course ...StatisticsISBN:9781305627734Author:Jeffrey D. Camm, James J. Cochran, Michael J. Fry, Jeffrey W. Ohlmann, David R. AndersonPublisher:Cengage Learning
 Excel Applications for Accounting PrinciplesAccountingISBN:9781111581565Author:Gaylord N. SmithPublisher:Cengage Learning