
Gen Combo Fundamentals Of Cost Accounting; Connect Access Card
6th Edition
ISBN: 9781260848700
Author: William N. Lanen Professor, Shannon Anderson Associate Professor, Michael W Maher
Publisher: McGraw-Hill Education
expand_more
expand_more
format_list_bulleted
Videos
Textbook Question
Chapter 5, Problem 65P
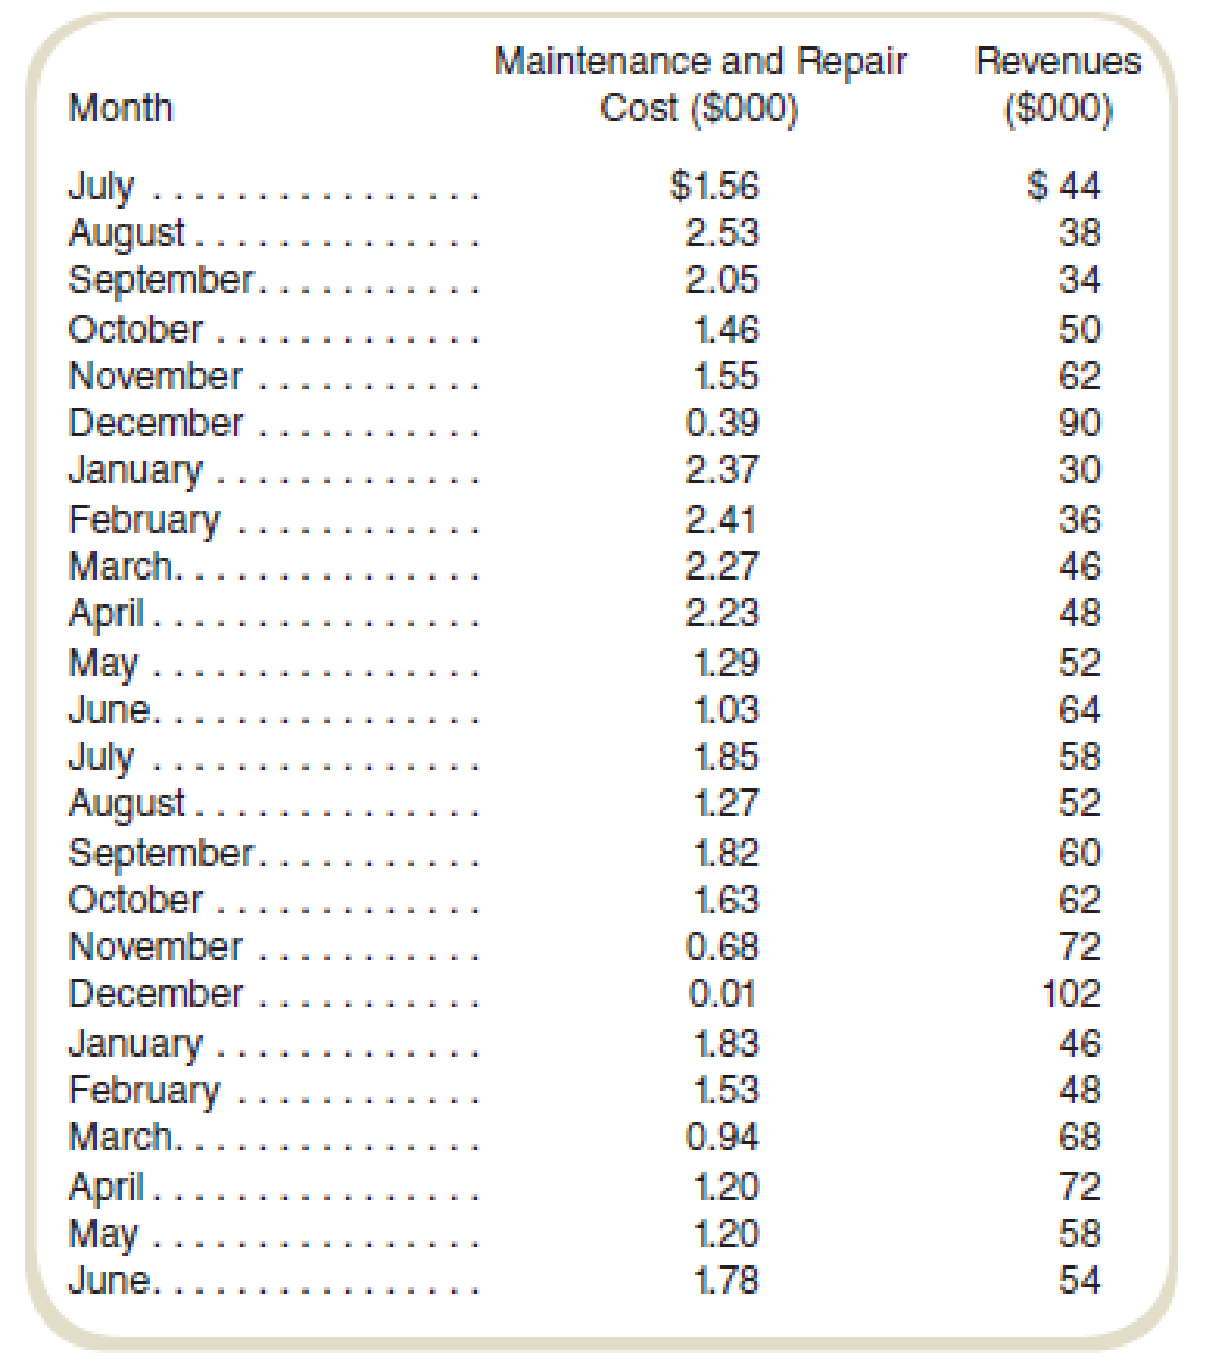
Cost Estimation: Simple Regression
The following information on maintenance and repair costs and revenues for the last two years is available from the accounting records at Arnie’s Arcade & Video Palace. Arnie has asked you to help him understand the relation between business volume and maintenance and repair cost.
Required
- a. Ignoring the data, would you predict that, in general, there is a positive relation between revenues and maintenance and repair costs? Why?
- b. Estimate a linear regression with maintenance and repair cost as the dependent variable and revenue as the independent variable. Does the result support your prediction in requirement (a)? What are some factors that may explain the result?
Expert Solution & Answer

Trending nowThis is a popular solution!

Students have asked these similar questions
High-low method; regression analysis. (CIMA, adapted) Catherine McCarthy, sales manager of Baxter Arenas, is checking to see if there is any relationship between promotional costs and ticket revenues at the sports stadium. She obtains the following data for the past 9 months:
Interpreting regression results. Spirit Freightways is a leader in transporting agricultural products in the western provinces of Canada. Reese Brown, a financial analyst at Spirit Freightways, is studying the behavior of transportation costs for budgeting purposes. Transportation costs at Spirit are of two types: (a) operating costs (such as labor and fuel) and (b) maintenance costs (primarily overhaul of vehicles). Brown gathers monthly data on each type of cost, as well as the total freight miles traveled by Spirit vehicles in each month. The data collected are shown below (all in thousands):
Conduct a regression using the monthly data of operating costs on freight miles. You should obtain the following result:
Regression: Operating costs = a + (b X Number of freight miles)
Plot the data and regression line for the above estimation. Evaluate the regression using the criteria of economic plausibility, goodness of fit, and slope of the regression line.
Brown expects Spirit to…
Curry Rubber manufactures rubber bands for retail companies. The accounting manager has performed a regression analysis of past data. You notice that the formula has an R-squared of 0.68, a t-value of 2.2, and a standard error of the estimate of $218,200. The estimate for next quarter costs is $2,597,623. Calculate Standard Error as a % of predicted total cost which represents a measure of precision of his regression analysis? (Round your answer to one decimal place, i.e., 0.052 = 5.2%.)
Chapter 5 Solutions
Gen Combo Fundamentals Of Cost Accounting; Connect Access Card
Ch. 5 - What are the common methods of cost estimation?Ch. 5 - Prob. 2RQCh. 5 - Under what conditions is the engineering estimates...Ch. 5 - If one wishes simply to prepare a cost estimate...Ch. 5 - When using cost estimation methods based on past...Ch. 5 - Prob. 6RQCh. 5 - What is the difference between R2 and adjusted R2?Ch. 5 - Why are accurate cost estimates important?Ch. 5 - What are three practical implementation problems...Ch. 5 - Why is it important to incorporate learning into...
Ch. 5 - What are some complications that can arise when...Ch. 5 - The following costs are labeled fixed or variable...Ch. 5 - Prob. 13CADQCh. 5 - When preparing cost estimates for account analysis...Ch. 5 - How can one compensate for the effects of price...Ch. 5 - Prob. 16CADQCh. 5 - Prob. 17CADQCh. 5 - A decision maker is interested in obtaining a cost...Ch. 5 - Consider the Business Application item Using...Ch. 5 - A friend comes to you with the following problem....Ch. 5 - After doing an account analysis and giving the...Ch. 5 - In doing cost analysis, you realize that there...Ch. 5 - Prob. 23CADQCh. 5 - Are learning curves likely to affect materials...Ch. 5 - McDonalds, the fast-food restaurant, is known for...Ch. 5 - Prob. 26CADQCh. 5 - A manager asks you for a cost estimate to open a...Ch. 5 - Prob. 28CADQCh. 5 - Methods of Estimating Costs: Engineering Estimates...Ch. 5 - Prob. 30ECh. 5 - Methods of Estimating Costs: Engineering Estimates...Ch. 5 - Prob. 32ECh. 5 - Methods of Estimating Costs: Account Analysis The...Ch. 5 - Methods of Estimating Costs: Account Analysis...Ch. 5 - Methods of Estimating Costs: High-Low, Ethical...Ch. 5 - Methods of Estimating Costs: High-Low Adriana...Ch. 5 - Methods of Estimating Costs: High-Low
Adriana...Ch. 5 - Prob. 38ECh. 5 - Adriana Corporation manufactures football...Ch. 5 - Methods of Estimating Costs: Simple...Ch. 5 - Prob. 41ECh. 5 - Methods of Estimating Costs: High-Low Davis Stores...Ch. 5 - Methods of Estimating Costs: Scattergraph Prepare...Ch. 5 - Prob. 44ECh. 5 - Interpretation of Regression Results: Multiple...Ch. 5 - Interpretation of Regression Results Brodie...Ch. 5 - Prob. 47ECh. 5 - Interpretation of Regression Results: Simple...Ch. 5 - Learning Curves Assume that General Dynamics,...Ch. 5 - Learning Curves Assume that Whee, Cheatham, and...Ch. 5 - Prob. 51ECh. 5 - Learning Curves (Appendix B) Refer to the example...Ch. 5 - Prob. 53PCh. 5 - Prob. 54PCh. 5 - Regressions from Published Data Obtain 13 years of...Ch. 5 - Prob. 56PCh. 5 - High-Low Method, Scattcrgraph Cubicle Solutions...Ch. 5 - High-Low Method, Scattcrgraph Academy Products...Ch. 5 - High-Low, Scattergraph, Issues with Data
Wyoming...Ch. 5 - Interpretation of Regression Results: Simple...Ch. 5 - Interpretation of Regression Results: Simple...Ch. 5 - Interpretation of Regression Results: Multiple...Ch. 5 - Interpretation of Regression Results: Simple...Ch. 5 - Interpretation of Regression Results Brews 4 U is...Ch. 5 - Cost Estimation: Simple Regression The following...Ch. 5 - Prob. 68PCh. 5 - Methods of Cost Analysis: Account Analysis, Simple...Ch. 5 - Learning Curves (Appendix B) Refer to the example...Ch. 5 - Learning Curves (Appendix B) Krylon Company...
Knowledge Booster


Learn more about
Need a deep-dive on the concept behind this application? Look no further. Learn more about this topic, accounting and related others by exploring similar questions and additional content below.Similar questions
- Refer to Cornerstone Exercise 3.4 for data on Dohini Manufacturing Companys purchasing cost and number of purchase orders. The controller for Dohini Manufacturing ran regression on the data, and the coefficients shown by the regression program are: Required: 1. Construct the cost formula for the purchasing activity showing the fixed cost and the variable rate. 2. If Dohini Manufacturing Company estimates that next month will have 430 purchase orders, what is the total estimated purchasing cost for that month? (Round your answer to the nearest dollar.) 3. What if Dohini Manufacturing wants to estimate purchasing cost for the coming year and expects 5,340 purchase orders? What will estimated total purchasing cost be? (Round your answer to the nearest dollar.) What is the total fixed purchasing cost? Why doesnt it equal the fixed cost calculated in Requirement 1?arrow_forwardThe president of a small manufacturing firm is concerned about the continual increase in manufacturing costs over the past several years. The following figures provide a time series of the cost per unit for the firms leading product over the past eight years: a. Construct a time series plot. What type of pattern exists in the data? b. Use simple linear regression analysis to find the parameters for the line that minimizes MSE for this time series. c. What is the average cost increase that the firm has been realizing per year? d. Compute an estimate of the cost/unit for next year.arrow_forwardEvaluating selling and administrative cost allocations Gordon Gecco Furniture Company has two major product lines with the following characteristics: Commercial office furniture: Few large orders, little advertising support, shipments in full truckloads, and low handling complexity Home office furniture: Many small orders, large advertising support, shipments in partial truckloads, and high handling complexity The company produced the following profitability report for management: The selling and administrative expenses are allocated to the products on the basis of relative sales dollars. Evaluate the accuracy of this report and recommend an alternative approach.arrow_forward
- Jensen Tire Auto is deciding whether to purchase a maintenance contract for its new computer wheel alignment and balancing machine. Managers feel that maintenance expense should be related to usage, and they collected the following information on weekly usage (hours) and annual maintenance expense (in hundreds of dollars). a. Develop a scatter chart with weekly usage hours as the independent variable. What does the scatter chart indicate about the relationship between weekly usage and annual maintenance expense? b. Use the data to develop an estimated regression equation that could be used to predict the annual maintenance expense for a given number of hours of weekly usage. What is the estimated regression model? c. Test whether each of the regression parameters 0 and 1 is equal to zero at a 0.05 level of significance. What are the correct interpretations of the estimated regression parameters? Are these interpretations reasonable? d. How much of the variation in the sample values of annual maintenance expense does the model you estimated in part (b) explain? e. If the maintenance contract costs 3,000 per year, would you recommend purchasing it? Why or why not?arrow_forwardA Using Common Size Statements The following income statement and vertical analysis data are available for Riley Manufacturing: Required: 1. CONCEPTUAL CONNECTION Suggest why net income declined from $273,200 to $41,600 while the cost of goods sold percentage decreased each year and selling and administrative expenses remained nearly constant. 2. CONCEPTUAL CONNECTION Determine what could cause sales to decline while the gross margin percentage increases.arrow_forward(Appendix 3A) Method of Least Squares Using Computer Spreadsheet Program Susan Lewis, owner of a florist shop, is interested in predicting the cost of delivering floral arrangements. She collected monthly data on the number of deliveries and the total monthly delivery cost (depreciation on the van, wages of the driver, and fuel) for the past year. Required: 1. Using a computer spreadsheet program such as Excel, run a regression on these data. Print out your results. 2. Using your results from Requirement 1, write the cost formula for delivery cost. (Note: Round the fixed cost to the nearest dollar and the variable rate to the nearest cent.) 3. CONCEPTUAL CONNECTION What is R2 based on your results? Do you think that the number of direct labor hours is a good predictor of delivery cost? 4. Using the cost formula in Requirement 2, what would predicted delivery cost be for a month with 300 deliveries?arrow_forward
- Refer to the information for Jasper Company on the previous page.Required:1. Prepare an income statement for Jasper for last year. Calculate the percentage of sales for eachline item on the income statement. (Note: Round percentages to the nearest tenth of a percent.)2. CONCEPTUAL CONNECTION Briefly explain how a manager could use the incomestatement created for Requirement 1 to better control costs.arrow_forwarda) Calculate the contribution margin per unit.b) Calculate the number of units Beauty Supplies Company must sell each year to break even.c) Calculate the number of units Beauty Supplies Company must sell to yield a profit of $160,000.d) Managers may use Sensitivity analysis in their accounting system.i) What is sensitivity analysis? ii) How is Sensitivity analysis useful to managers?arrow_forwardUsing Multiple Regression Results to Construct and Apply a Cost Formula The controller for Dohini Manufacturing Company felt that the number of purchase orders alone did not explain the monthly purchasing cost. He knew that nonstandard orders (for example, one requiring an overseas supplier) took more time and effort. He collected data on the number of nonstandard orders for the past 12 months and added that information to the data on purchasing cost and total number of purchase orders. Month Purchasing Cost Number of Purchase Orders Number of Nonstandard Orders January $18,860 370 53 February 18,065 330 35 March 19,250 370 61 April 18,050 410 14 May 19,345 400 73 June 19,500 450 55 July 19,670 460 30 August 20,940…arrow_forward
- Analyzing profitability analysis, service company Burlington Internet Services is an Internet service provider for commercial and residential Customers. The company provided the following data for its two types of customers for the month of August: For each type of customer, determine both the contribution margin per customer and the contribution margin ratio. Round to twos decimal places. Which type of service and more profitable?arrow_forwardComputing breakeven sales and sales needed to earn a target profit; graphing CVP relationships; performing sensitivity analysis National Investor Group is opening an office in Portland, Oregon. Fixed monthly costs are office rent ($8,100), depreciation on office furniture ($1,700), utilities ($2,000), special telephone lines ($1,500), a connection with an online brokerage service ($2,500), and the salary of a financial planner ($5,200). Variable costs include payments to the financial planner (9% of revenue), advertising (11% of revenue), supplies and postage (4% of revenue), and usage fees for the telephone lines and computerized brokerage service (6% of revenue). Requirements Use the contribution margin ratio approach to compute Nationals breakeven revenue in dollars. If the average trade leads to $1,000 in revenue for National, how many trades must be made to break even? Use the equation approach to compute the dollar revenues needed to earn a monthly target profit of $12,600.…arrow_forwardMatching graphs with descriptions of cost and revenue behavior. (D. Green, adapted) Given here are a number of graphs. The horizontal axis of each graph represents the units produced over the year, and the vertical axis represents total cost or revenues. Indicate by number which graph best fits the situation or item described (a–h). Some graphs may be used more than once; some may not apply to any of the situations. Direct material costs Supervisors’ salaries for one shift and two shifts A cost-volume-profit graph Mixed costs—for example, car rental fixed charge plus a rate per mile driven Depreciation of plant, computed on a straight-line basis Data supporting the use of a variable-cost rate, such as manufacturing labor cost of $14 per unit produced Incentive bonus plan that pays managers $0.10 for every unit produced above some level of production Interest expense on $2 million borrowed at a fixed rate of interestarrow_forward
arrow_back_ios
SEE MORE QUESTIONS
arrow_forward_ios
Recommended textbooks for you
 Cornerstones of Financial AccountingAccountingISBN:9781337690881Author:Jay Rich, Jeff JonesPublisher:Cengage Learning
 Excel Applications for Accounting PrinciplesAccountingISBN:9781111581565Author:Gaylord N. SmithPublisher:Cengage Learning
 Essentials of Business Analytics (MindTap Course ...StatisticsISBN:9781305627734Author:Jeffrey D. Camm, James J. Cochran, Michael J. Fry, Jeffrey W. Ohlmann, David R. AndersonPublisher:Cengage Learning
 Managerial Accounting: The Cornerstone of Busines...AccountingISBN:9781337115773Author:Maryanne M. Mowen, Don R. Hansen, Dan L. HeitgerPublisher:Cengage Learning
 Cornerstones of Cost Management (Cornerstones Ser...AccountingISBN:9781305970663Author:Don R. Hansen, Maryanne M. MowenPublisher:Cengage Learning
 Managerial AccountingAccountingISBN:9781337912020Author:Carl Warren, Ph.d. Cma William B. TaylerPublisher:South-Western College Pub
Cornerstones of Financial Accounting
Accounting
ISBN:9781337690881
Author:Jay Rich, Jeff Jones
Publisher:Cengage Learning
Excel Applications for Accounting Principles
Accounting
ISBN:9781111581565
Author:Gaylord N. Smith
Publisher:Cengage Learning
Essentials of Business Analytics (MindTap Course ...
Statistics
ISBN:9781305627734
Author:Jeffrey D. Camm, James J. Cochran, Michael J. Fry, Jeffrey W. Ohlmann, David R. Anderson
Publisher:Cengage Learning
Managerial Accounting: The Cornerstone of Busines...
Accounting
ISBN:9781337115773
Author:Maryanne M. Mowen, Don R. Hansen, Dan L. Heitger
Publisher:Cengage Learning
Cornerstones of Cost Management (Cornerstones Ser...
Accounting
ISBN:9781305970663
Author:Don R. Hansen, Maryanne M. Mowen
Publisher:Cengage Learning
Managerial Accounting
Accounting
ISBN:9781337912020
Author:Carl Warren, Ph.d. Cma William B. Tayler
Publisher:South-Western College Pub
How to Estimate Project Costs: A Method for Cost Estimation; Author: Online PM Courses - Mike Clayton;https://www.youtube.com/watch?v=YQ2Wi3Jh3X0;License: Standard Youtube License