Videos
John Thomas, vice president of Mallett Company (a producer of a variety of plastic products), has been supervising the implementation of an ABC management system. John wants to improve process efficiency by improving the activities that define the processes. To illustrate the potential of the new system to the president, John has decided to focus on two processes: production and customer service.
Within each process, one activity will be selected for improvement: materials usage for production and sustaining engineering for customer service (sustaining engineers are responsible for redesigning products based on customer needs and feedback). Value-added standards are identified for each activity. For materials usage, the value-added standard calls for six pounds per unit of output (the products differ in shape and function, but their weight is uniform). The value-added standard is based on the elimination of all waste due to defective molds. The standard price of materials is $5 per pound. For sustaining engineering, the standard is 58% of current practical activity capacity. This standard is based on the fact that about 42% of the complaints have to do with design features that could have been avoided or anticipated by the company.
Current practical capacity (at the end of 20X1) is defined by the following requirements: 6,000 engineering hours for each product group that has been on the market or in development for 5 years or less and 2,400 hours per product group of more than 5 years. Four product groups have less than 5 years’ experience, and 10 product groups have more. Each of the 24 engineers is paid a salary of $60,000. Each engineer can provide 2,000 hours of service per year. No other significant costs are incurred for the engineering activity.
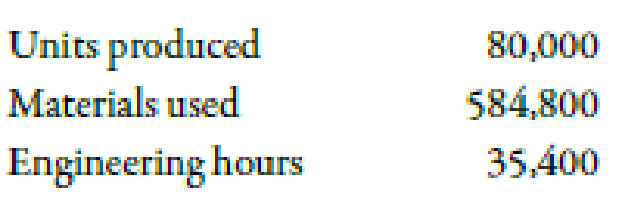
Actual materials usage for 20X1 was 25% above the level called for by the value-added standard; engineering usage was 46,000 hours. A total of 80,000 units of output were produced. John and the operational managers have selected some improvement measures that promise to reduce nonvalue-added activity usage by 40% in 20X2. Selected actual results achieved for 20X2 are as follows:
The actual prices paid for materials and engineering hours are identical to the standard or budgeted prices.
Required:
- 1. For 20X1, calculate the nonvalue-added usage and costs for materials usage and sustaining engineering.
- 2. CONCEPTUAL CONNECTION Using the budgeted improvements, calculate the expected activity usage levels for 20X2. Now, compute the 20X2 usage variances (the difference between the expected and actual values), expressed in both physical and financial measures, for materials and engineering. Comment on the company’s ability to achieve its targeted reductions. In particular, discuss what measures the company must take to capture any realized reductions in resource usage.
1.
Calculate the value of accounting costs which is apportion to a backpack before the duffle-bag line was added with the help of plant wide rate approach. Also, identify whether this approach is accurate or not.
Explanation of Solution
Non-Value Added Cost:
Non-value added cost refers to the cash and cash equivalents which are incurred due to the non-value activities or by the ineffective presentation of value-added activities.
Calculation of non-value added usage and costs for 20X1:
| Particulars |
Actual Quantity (A) |
Value added Quantity (B) |
Non-value usage (C) |
Standard Price (D) |
Non-value cost ($) |
| Materials | 600,0001 | 480,0003 | 120,000 | 5 | 600,000 |
| Engineering | 48,0002 | 27,8404 | 20,160 | 305 | 604,800 |
Table (1)
Working Note:
1.
Calculation of actual quantity of material:
2.
Calculation of actual quantity of engineering:
3.
Calculation of value added quantity of material:
4.
Calculation of value added quantity of engineering:
5.
Calculation of standard price of engineering:
2.
Compute the value of expected activity usage levels for 20X2 with the help of budgeted improvements. Also, calculate the value of usage variances for 20X2. Explain the measures that company should take to capture any reductions in resource usage.
Explanation of Solution
Use the following formula to calculate expected activity usage levels for materials:
Substitute $480,000 for value added quantity, 60% for value added activity usage and 120,000 for non-value usage in the above formula.
Therefore, an expected activity usage level for materials is 552,000 pounds.
Use the following formula to calculate expected activity usage levels for engineering:
Substitute $27,840 for value added quantity, 60% for value added activity usage and 20,160 for non-value usage in the above formula.
Therefore, an expected activity usage level for engineering is 39,936 hours.
Calculation of non-value added usage and costs for 20X2:
| Particulars |
Actual Quantity (A) |
Expected Quantity (B) |
Excess Non-value usage (C) |
Standard Price (D) |
Excess Non-value cost ($) |
| Materials | 584,800 | 552,000 | 32,800 | 5 | 164,000(U) |
| Engineering | 35,400 | 39,936 | 4,536 | 30 | 136,080(F) |
Table (2)
According to the above calculations, company is not able to attain the material standard but successfully achieve the engineering standard. The actual consumption of engineering is 35,400 hours and the activity usage is 48,000. Therefore, company is able to create an unused capacity of engineering of 12,600 hours
- Company lay off the six engineers to increase the total profits of the organization by saving the salaries amount of $360,000.
- Company should reassign the activities that have insufficient resources it will also helps to the organization in saving the engineering cost.
Want to see more full solutions like this?
Chapter 5 Solutions
Bundle: Managerial Accounting: The Cornerstone of Business Decision-Making, Loose-Leaf Version, 7th + CengageNOWv2, 1 term (6 months) Printed Access Card


- Tom Young, vice president of Dunn Company (a producer of plastic products), has been supervising the implementation of an activity-based cost management system. One of Toms objectives is to improve process efficiency by improving the activities that define the processes. To illustrate the potential of the new system to the president, Tom has decided to focus on two processes: production and customer service. Within each process, one activity will be selected for improvement: molding for production and sustaining engineering for customer service. (Sustaining engineers are responsible for redesigning products based on customer needs and feedback.) Value-added standards are identified for each activity. For molding, the value-added standard calls for nine pounds per mold. (Although the products differ in shape and function, their size, as measured by weight, is uniform.) The value-added standard is based on the elimination of all waste due to defective molds (materials is by far the major cost for the molding activity). The standard price for molding is 15 per pound. For sustaining engineering, the standard is 60 percent of current practical activity capacity. This standard is based on the fact that about 40 percent of the complaints have to do with design features that could have been avoided or anticipated by the company. Current practical capacity (the first year) is defined by the following requirements: 18,000 engineering hours for each product group that has been on the market or in development for five years or less, and 7,200 hours per product group of more than five years. Four product groups have less than five years experience, and 10 product groups have more. There are 72 engineers, each paid a salary of 70,000. Each engineer can provide 2,000 hours of service per year. There are no other significant costs for the engineering activity. For the first year, actual pounds used for molding were 25 percent above the level called for by the value-added standard; engineering usage was 138,000 hours. There were 240,000 units of output produced. Tom and the operational managers have selected some improvement measures that promise to reduce non-value-added activity usage by 30 percent in the second year. Selected actual results achieved for the second year are as follows: The actual prices paid per pound and per engineering hour are identical to the standard or budgeted prices. Required: 1. For the first year, calculate the non-value-added usage and costs for molding and sustaining engineering. Also, calculate the cost of unused capacity for the engineering activity. 2. Using the targeted reduction, establish kaizen standards for molding and engineering (for the second year). 3. Using the kaizen standards prepared in Requirement 2, compute the second-year usage variances, expressed in both physical and financial measures, for molding and engineering. (For engineering, explain why it is necessary to compare actual resource usage with the kaizen standard.) Comment on the companys ability to achieve its targeted reductions. In particular, discuss what measures the company must take to capture any realized reductions in resource usage.arrow_forwardJoseph Fox, controller of Thorpe Company, has been in charge of a project to install an activity-based cost management system. This new system is designed to support the companys efforts to become more competitive. For the past six weeks, he and the project committee members have been identifying and defining activities, associating workers with activities, and assessing the time and resources consumed by individual activities. Now, he and the project committee are focusing on three additional implementation issues: (1) identifying activity drivers, (2) assessing value content, and (3) identifying cost drivers (root causes). Joseph has assigned a committee member the responsibilities of assessing the value content of five activities, choosing a suitable activity driver for each activity, and identifying the possible root causes of the activities. Following are the five activities with possible activity drivers: The committee member ran a regression analysis for each potential activity driver, using the method of least squares to estimate the variable and fixed cost components. In all five cases, costs were highly correlated with the potential drivers. Thus, all drivers appeared to be good candidates for assigning costs to products. The company plans to reward production managers for reducing product costs. Required: 1. What is the difference between an activity driver and a cost driver? In answering the question, describe the purpose of each type of driver. 2. For each activity, assess the value content and classify each activity as value-added or non-value-added (justify the classification). Identify some possible root causes of each activity, and describe how this knowledge can be used to improve activity performance. For purposes of discussion, assume that the value-added activities are not performed with perfect efficiency. 3. Describe the behavior that each activity driver will encourage, and evaluate the suitability of that behavior for the companys objective of becoming more competitive.arrow_forwardRandy Harris, controller, has been given the charge to implement an advanced cost management system. As part of this process, he needs to identify activity drivers for the activities of the firm. During the past four months, Randy has spent considerable effort identifying activities, their associated costs, and possible drivers for the activities costs. Initially, Randy made his selections based on his own judgment using his experience and input from employees who perform the activities. Later, he used regression analysis to confirm his judgment. Randy prefers to use one driver per activity, provided that an R2 of at least 80 percent can be produced. Otherwise, multiple drivers will be used, based on evidence provided by multiple regression analysis. For example, the activity of inspecting finished goods produced an R2 of less than 80 percent for any single activity driver. Randy believes, however, that a satisfactory cost formula can be developed using two activity drivers: the number of batches and the number of inspection hours. Data collected for a 14-month period are as follows: Required: 1. Calculate the cost formula for inspection costs using the two drivers, inspection hours and number of batches. Are both activity drivers useful? What does the R2 indicate about the formula? 2. Using the formula developed in Requirement 1, calculate the inspection cost when 300 inspection hours are used and 30 batches are produced. Prepare a 90 percent confidence interval for this prediction.arrow_forward
- Kagle design engineers are in the process of developing a new green product, one that will significantly reduce impact on the environment and yet still provide the desired customer functionality. Currently, two designs are being considered. The manager of Kagle has told the engineers that the cost for the new product cannot exceed 550 per unit (target cost). In the past, the Cost Accounting Department has given estimated costs using a unit-based system. At the request of the Engineering Department, Cost Accounting is providing both unit-and activity-based accounting information (made possible by a recent pilot study producing the activity-based data). Unit-based system: Variable conversion activity rate: 100 per direct labor hour Material usage rate: 20 per part ABC system: Labor usage: 15 per direct labor hour Material usage (direct materials): 20 per part Machining: 75 per machine hour Purchasing activity: 150 per purchase order Setup activity: 3,000 per setup hour Warranty activity: 500 per returned unit (usually requires extensive rework) Customer repair cost: 25 per repair hour (average) Required: 1. Select the lower-cost design using unit-based costing. Are logistical and post-purchase activities considered in this analysis? 2. Select the lower-cost design using ABC analysis. Explain why the analysis differs from the unit-based analysis. 3. What if the post-purchase cost was an environmental contaminant and amounted to 10 per unit for Design A and 40 per unit for Design B? Assume that the environmental cost is borne by society. Now which is the better design?arrow_forwardTwo departments within Cougar Gear Inc. are Production and Sales. Each department has a unique scorecard, as follows: The Production Department scorecard focuses on the learning and growth and internal processes perspectives. The Sales Department scorecard focuses on the learning and growth and customer perspectives. Both scorecards have the learning and growth performance metrics of median training hours per employee and average employee tenure. The Production scorecard has the unique metrics of production time per unit and number of production shutdowns. The Sales scorecard has the unique metrics of percentage of customers who shop again and online customer satisfaction rating. The performance targets for each metric are shown in the tan boxes just under the performance metrics. The actual achieved metrics are shown in the red boxes just below the tan boxes. When evaluating both departments, Cougar Gears management looks at the median training hours per employee and average employee tenure metrics and subsequently decides to give the Sales Department a large bonus while giving the Production Department a minimal bonus. a. Determine and define the type of cognitive bias Cougar Gears management has exhibited in this instance. b. Determine which department would have received the larger bonus had the companys management not been biased in the evaluation. c. Discuss one advantage and one disadvantage of using unique balanced scorecards for different departments or divisions of a company.arrow_forwardThe management of Wheeler Company has decided to develop cost formulas for its major overhead activities. Wheeler uses a highly automated manufacturing process, and power costs are a significant manufacturing cost. Cost analysts have decided that power costs are mixed; thus, they must be broken into their fixed and variable elements so that the cost behavior of the power usage activity can be properly described. Machine hours have been selected as the activity driver for power costs. The following data for the past eight quarters have been collected: Required: 1. Prepare a scattergraph by plotting power costs against machine hours. Does the scatter-graph show a linear relationship between machine hours and power cost? 2. Using the high and low points, compute a power cost formula. 3. Use the method of least squares to compute a power cost formula. Evaluate the coefficient of determination. 4. Rerun the regression and drop the point (20,000; 26,000) as an outlier. Compare the results from this regression to those for the regression in Requirement 3. Which is better?arrow_forward
- Classify the following cost drivers as structural, executional, or operational. a. Number of plants b. Number of moves c. Degree of employee involvement d. Capacity utilization e. Number of product lines f. Number of distribution channels g. Engineering hours h. Direct labor hours i. Scope j. Product configuration k. Quality management approach l. Number of receiving orders m. Number of defective units n. Employee experience o. Types of process technologies p. Number of purchase orders q. Type and efficiency of layout r. Scale s. Number of functional departments t. Number of planning meetingsarrow_forwardJolene Askew, manager of Feagan Company, has committed her company to a strategically sound cost reduction program. Emphasizing life-cycle cost management is a major part of this effort. Jolene is convinced that production costs can be reduced by paying more attention to the relationships between design and manufacturing. Design engineers need to know what causes manufacturing costs. She instructed her controller to develop a manufacturing cost formula for a newly proposed product. Marketing had already projected sales of 25,000 units for the new product. (The life cycle was estimated to be 18 months. The company expected to have 50 percent of the market and priced its product to achieve this goal.) The projected selling price was 20 per unit. The following cost formula was developed: Y=200,000+10X1 where X1=Machinehours(Theproductisexpectedtouseonemachinehourforeveryunitproduced.) Upon seeing the cost formula, Jolene quickly calculated the projected gross profit to be 50,000. This produced a gross profit of 2 per unit, well below the targeted gross profit of 4 per unit. Jolene then sent a memo to the Engineering Department, instructing them to search for a new design that would lower the costs of production by at least 50,000 so that the target profit could be met. Within two days, the Engineering Department proposed a new design that would reduce unit-variable cost from 10 per machine hour to 8 per machine hour (Design Z). The chief engineer, upon reviewing the design, questioned the validity of the controllers cost formula. He suggested a more careful assessment of the proposed designs effect on activities other than machining. Based on this suggestion, the following revised cost formula was developed. This cost formula reflected the cost relationships of the most recent design (Design Z). Y=140,000+8X1+5,000X2+2,000X3 where X1=MachinehoursX2=NumberofbatchesX3=Numberofengineeringchangeorders Based on scheduling and inventory considerations, the product would be produced in batches of 1,000; thus, 25 batches would be needed over the products life cycle. Furthermore, based on past experience, the product would likely generate about 20 engineering change orders. This new insight into the linkage of the product with its underlying activities led to a different design (Design W). This second design also lowered the unit-level cost by 2 per unit but decreased the number of design support requirements from 20 orders to 10 orders. Attention was also given to the setup activity, and the design engineer assigned to the product created a design that reduced setup time and lowered variable setup costs from 5,000 to 3,000 per setup. Furthermore, Design W also creates excess activity capacity for the setup activity, and resource spending for setup activity capacity can be decreased by 40,000, reducing the fixed cost component in the equation by this amount. Design W was recommended and accepted. As prototypes of the design were tested, an additional benefit emerged. Based on test results, the post-purchase costs dropped from an estimated 0.70 per unit sold to 0.40 per unit sold. Using this information, the Marketing Department revised the projected market share upward from 50 percent to 60 percent (with no price decrease). Required: 1. Calculate the expected gross profit per unit for Design Z using the controllers original cost formula. According to this outcome, does Design Z reach the targeted unit profit? Repeat, using the engineers revised cost formula. Explain why Design Z failed to meet the targeted profit. What does this say about the use of unit-based costing for life-cycle cost management? 2. Calculate the expected profit per unit using Design W. Comment on the value of activity information for life-cycle cost management. 3. The benefit of the post-purchase cost reduction of Design W was discovered in testing. What direct benefit did it create for Feagan Company (in dollars)? Reducing post-purchase costs was not a specific design objective. Should it have been? Are there any other design objectives that should have been considered?arrow_forwardAnderson Company has the following departmental manufacturing structure for one of its products: After some study, the production manager of Anderson recommended the following revised cellular manufacturing approach: Required: 1. Calculate the total time it takes to produce a batch of 20 units using Andersons traditional departmental structure. 2. Using cellular manufacturing, how much time is saved producing the same batch of 20 units? Assuming the cell operates continuously, what is the production rate? Which process controls this production rate? 3. What if the processing times of molding, welding, and assembly are all reduced to six minutes each? What is the production rate now, and how long will it take to produce a batch of 20 units?arrow_forward
- Horsepower Hookup, Inc., is a large automobile company that specializes in the production of high-powered trucks. The company is determining cost allocations for purposes of performance evaluation. A portion of company bonuses depends on divisions achieving cost management goals. This necessitates highly accurate support department cost allocation. Management has also stated that it has the means to implement as complex a method as necessary. The general manager over the Mid-Size D wants to get a good idea of what factors are driving the costs of the support departments in order to make accurate cost allocations, so finding accurate support department cost drivers is important. Support department costs include Janitorial ($163,100) and Security ($285,400). The Janitorial costs vary depending on the number of vehicles produced, increasing with larger production volumes. Security costs are fixed based on the size of the lot, and do not change with respect to how many vehicles are in the…arrow_forwardHorsepower Hookup, Inc., is a large automobile company that specializes in the production of high-powered trucks. The company is determining cost allocations for purposes of performance evaluation. A portion of company bonuses depends on divisions achieving cost management goals. This necessitates highly accurate support department cost allocation. Management has also stated that it has the means to implement as complex a method as necessary. The general manager over the Mid-Size D wants to get a good idea of what factors are driving the costs of the support departments in order to make accurate cost allocations, so finding accurate support department cost drivers is important. Support department costs include Janitorial ($163,100) and Security ($285,400). The Janitorial costs vary depending on the number of vehicles produced, increasing with larger production volumes. Security costs are fixed based on the size of the lot, and do not change with respect to how many vehicles are in the…arrow_forwardHorsepower Hookup, Inc., is a large automobile company that specializes in the production of high-powered trucks. The company is determining cost allocations for purposes of performance evaluation. A portion of company bonuses depends on divisions achieving cost management goals. This necessitates highly accurate support department cost allocation. Management has also stated that it has the means to implement as complex a method as necessary. The general manager over the Mid-Size D wants to get a good idea of what factors are driving the costs of the support departments in order to make accurate cost allocations, so finding accurate support department cost drivers is important. Support department costs include Janitorial ($163,100) and Security ($285,400). The Janitorial costs vary depending on the number of vehicles produced, increasing with larger production volumes. Security costs are fixed based on the size of the lot, and do not change with respect to how many vehicles are in the…arrow_forward
 Managerial Accounting: The Cornerstone of Busines...AccountingISBN:9781337115773Author:Maryanne M. Mowen, Don R. Hansen, Dan L. HeitgerPublisher:Cengage Learning
 Cornerstones of Cost Management (Cornerstones Ser...AccountingISBN:9781305970663Author:Don R. Hansen, Maryanne M. MowenPublisher:Cengage Learning
 Financial And Managerial AccountingAccountingISBN:9781337902663Author:WARREN, Carl S.Publisher:Cengage Learning,
 Managerial AccountingAccountingISBN:9781337912020Author:Carl Warren, Ph.d. Cma William B. TaylerPublisher:South-Western College Pub