
Biological Science (7th Edition)
7th Edition
ISBN: 9780134678320
Author: Scott Freeman, Kim Quillin, Lizabeth Allison, Michael Black, Greg Podgorski, Emily Taylor, Jeff Carmichael
Publisher: PEARSON
expand_more
expand_more
format_list_bulleted
Concept explainers
Question
Chapter 50, Problem 13PIAT
Summary Introduction
To review:
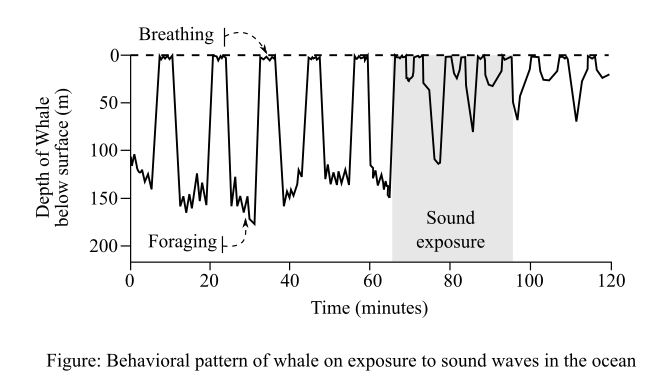
The duration of foraging of the whale before and after the exposure of sound in the ocean. Also, predict the effect of sonar on the whale’s fitness.
Introduction:
Whales communicate with each other using sound under water. They also detect their enemy, food (small fishes), and obstacles using these sound waves. The military sonars produce the same kind of waves, which interfere with the communication of whales with one another. An experiment was performed to check the effect of sound waves on the behavior of a whale. The results are given in the graph below:
Expert Solution & Answer
Want to see the full answer?
Check out a sample textbook solution
Students have asked these similar questions
Use Verbal description of results from graph and then Interpret the graph for Speacialization scenario in foraging lab. The interpretations must include:
Were the results expected and Did they support the hypotheses? If so, state the biological significance of the results from graph. If the results deviated significantly from expected results, discuss the hypotheses onthe basis of expected results and include an explanation of why this might be so. Lastly, state the conclusions drawn from the experiment and their biological relevance.
Hypothesis: Within the context of specialization, foragers will exhibit differences in foraging efficiency between pure and mixed food types, with the expectation that they will perform more efficiently when searching for their preferred pure food type compared to mixed food. This difference in efficiency may be reflected in factors such as foraging times, success rates, or other relevant measures.
Prey size may favor a particular body size among pumas. Graph the relationship between puma weight and prey weight. Pay attention to which variable is the independent variable.
Chapter 50 Solutions
Biological Science (7th Edition)
Ch. 50 - Prob. 1TYKCh. 50 - Prob. 2TYKCh. 50 - Prob. 5TYUCh. 50 - Propose an evolutionary hypothesis to explain the...Ch. 50 - Prob. 8TYUCh. 50 - 10. J. B. S. Haldane once remarked that he’d be...Ch. 50 - Prob. 11PIATCh. 50 - Researchers followed tagged blue whales to observe...Ch. 50 - Prob. 13PIATCh. 50 - Prob. 14PIAT
Knowledge Booster


Learn more about
Need a deep-dive on the concept behind this application? Look no further. Learn more about this topic, biology and related others by exploring similar questions and additional content below.Similar questions
- Use Verbal description of results from graph and then Interpret the graph for Novice vs. Exprienced sccenario in foraging lab. The interpretations must include Were the results expected and Did they support the hypotheses? If so, state the biological significance of the results from graph. If the results deviated significantly from expected results, discuss the hypotheses onthe basis of expected results and include an explanation of why this might be so. Lastly, state the conclusions drawn from the experiment and their biological relevance. Hypothesis: In Foraging is that animals with prior foraging experience would demonstrate higher survival rates than novice foragers, emphasizing the role of experience in honing foraging skills.arrow_forwardUse Verbal description of results from graph and then Interpret the graph for Foraging in Mixed Species Flocks sccenario in foraging lab. The interpretations must include Were the results expected and Did they support the hypotheses? If so, state the biological significance of the results from graph. If the results deviated significantly from expected results, discuss the hypotheses onthe basis of expected results and include an explanation of why this might be so. Lastly, state the conclusions drawn from the experiment and their biological relevance. Hypothesis: the assumption underscores the enhancement of foraging efficiency associated with the establishment of mixed-species flocks, emphasizing the advantages of cooperation and safety in numbers.arrow_forwardUse Verbal description of results from graph and then Interpret the graph for Exclusive range sccenario in foraging lab. The interpretations must include Were the results expected and Did they support the hypotheses? If so, state the biological significance of the results from graph. If the results deviated significantly from expected results, discuss the hypotheses onthe basis of expected results and include an explanation of why this might be so. Lastly, state the conclusions drawn from the experiment and their biological relevance. Hypothesis: In the context of exclusive ranges, the foraging times would be significantly affected by the introduction of competition, as opposed to territoriality. This increased competition was expected to deplete food resources and result in harassment by competing individuals.arrow_forward
- Give typing answer with explanation and conclusionarrow_forwardUse Verbal description of results from graph and then Interpret the graph for Pre camouflage sccenario in foraging lab. The interpretations must include Were the results expected and Did they support the hypotheses? If so, state the biological significance of the results from graph. If the results deviated significantly from expected results, discuss the hypotheses onthe basis of expected results and include an explanation of why this might be so. Lastly, state the conclusions drawn from the experiment and their biological relevance. Hypothesis: In the scenario involving prey camouflage, the hypothesis is that species taking extended periods to forage, especially novice foragers, would be at heightened risk of predation due to their prolonged exposure.arrow_forwardUse Verbal description of results from graph and then Interpret the graph for Pre camouflage sccenario in foraging lab. The interpretations must include Were the results expected and Did they support the hypotheses? If so, state the biological significance of the results from graph. If the results deviated significantly from expected results, discuss the hypotheses onthe basis of expected results and include an explanation of why this might be so. Lastly, state the conclusions drawn from the experiment and their biological relevance. Hypothesis: n the scenario involving prey camouflage, the hypothesis is that prey species will exhibit seasonal variations in their choice of beans for consumption based on the available background vegetation, with a preference for pinto beans during the first half of winter when they are more visually similar to their surroundings and a preference for pea beans during the second half of winter when they better match the changing background vegetation.arrow_forward
- Give typing answer with explanation and conclusion Why is it important to do more than one capture and release when doing population sampling studies?arrow_forwardsearch for information about rabbits about their use for research, abound in information. put a referencearrow_forwardInterpret the following graphs: In the graphs, the number of days are 18.. 1 day is equal to 60 sec. For the first graph, days are taken on x-axis. The mean foraging times are taken on y-axis. For the 2nd graph, percentage of prey caught during first half of winter(1-6days) were taken on x-axis and percentage of prey caught during 2nd half of winter(7-12days) were taken on y-axis.arrow_forward
- Give typing answer with explanation and conclusion A population of 60 sand pipers is foraging for mussels across two equally sized beaches. One beach has twice the number of mussels than the other beach. How many sand pipers are expected to forage in the beach with more mussels? • a. 20 • b. 30 • c. 40arrow_forwardections: Read each question below carefully, determine correct equation to use, and calculate for the variable ng asked for in the question. Show your work. 1. A population of 20 velociraptors has 4 babies in one breeding season. However, 2 of the older velociraptors die off due to old age. What is the growth rate of this population of velociraptors? Type answer here A population of 100 mice has a growth rate of 0.2. In an exponential growth environment, what is tharrow_forwardinterpret the following graph: In the graph, the number of days are 18.. 1 day is equal to 60 sec. days are taken on x-axis. The mean foraging times are taken on y-axis.arrow_forward
arrow_back_ios
SEE MORE QUESTIONS
arrow_forward_ios
Recommended textbooks for you
 Concepts of BiologyBiologyISBN:9781938168116Author:Samantha Fowler, Rebecca Roush, James WisePublisher:OpenStax College
 Biology (MindTap Course List)BiologyISBN:9781337392938Author:Eldra Solomon, Charles Martin, Diana W. Martin, Linda R. BergPublisher:Cengage Learning
Concepts of Biology
Biology
ISBN:9781938168116
Author:Samantha Fowler, Rebecca Roush, James Wise
Publisher:OpenStax College
Biology (MindTap Course List)
Biology
ISBN:9781337392938
Author:Eldra Solomon, Charles Martin, Diana W. Martin, Linda R. Berg
Publisher:Cengage Learning