Statistics Through Applications
2nd Edition
ISBN: 9781429219747
Author: Daren S. Starnes, David Moore, Dan Yates
Publisher: Macmillan Higher Education
bartleby

Videos

Question
Book Icon
Chapter 5.2, Problem 5.54E
To determine

To stimulate the results of fifty samples by counting the number of 0s and 1s in the first 25 entries in each of the fifty rows of Table B and then make histogram to display the result and then explain that is the truth about the population near the center of your graph or not and what are the largest and the smallest counts of the unemployed students we obtained in our fifty sample and what percent of our sample had either 4,5,or 6 unemployed.

Expert Solution & Answer
Check Mark

Answer to Problem 5.54E

Yes it is.

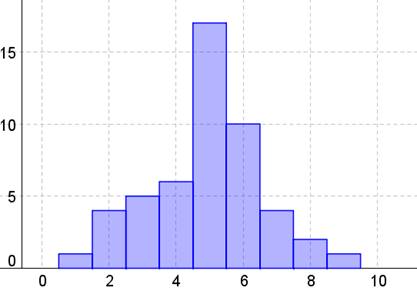
The smallest count is 1 .

The largest count is 9

Percent of sample is 66%

Explanation of Solution

  The digits 0 and 1 represent unemployes students. we count the number of 0s and 1sof the first 25 entries in each rows of table B. The resulting count will then represent the number of unemployed students in a sample of size 25.Row 101: 5 UnemployedRow 101: 5 UnemployedRow 101: 5 UnemployedRow 101: 8 UnemployedRow 101: 6 UnemployedRow 101: 5 UnemployedRow 101: 6 UnemployedRow 101: 6 UnemployedRow 101: 5 UnemployedRow 101: 1 UnemployedRow 101: 6 UnemployedRow 101: 5 UnemployedRow 101: 7 UnemployedRow 101: 5 UnemployedRow 101: 4 UnemployedRow 101: 7 UnemployedRow 101: 4 UnemployedRow 101: 5 UnemployedRow 101: 5 UnemployedRow 101: 3 UnemployedSimilarly, the rsult for the remaining 30 rows are:5,5,6,7,4,4,4,5,2,6,9,2,8,5,6,2,5,5,5,6,3,3,2,4,5,6,3,7,3,6

The histogram is as follows:

Statistics Through Applications, Chapter 5.2, Problem 5.54E

  We note that the highest bar in the histogram is at 5, thus the center of the distributionis 5 and this corresponds with an unemployment rate of 20%.The samllest count was 1 unemployed, while the highest count was 9 unemployed.6+17+10=30 of the 50 samples had a count of 4,5 or 6.3350=0.66=66%Thus 66% of the sample had a count of 4,5 or 6 unemployed.

Chapter 5 Solutions

Statistics Through Applications

Ch. 5.1 - Prob. 5.11ECh. 5.1 - Prob. 5.12ECh. 5.1 - Prob. 5.13ECh. 5.1 - Prob. 5.14ECh. 5.1 - Prob. 5.15ECh. 5.1 - Prob. 5.16ECh. 5.1 - Prob. 5.17ECh. 5.1 - Prob. 5.18ECh. 5.1 - Prob. 5.19ECh. 5.1 - Prob. 5.20ECh. 5.1 - Prob. 5.21ECh. 5.1 - Prob. 5.22ECh. 5.1 - Prob. 5.23ECh. 5.1 - Prob. 5.24ECh. 5.1 - Prob. 5.25ECh. 5.1 - Prob. 5.26ECh. 5.2 - Prob. 5.27ECh. 5.2 - Prob. 5.28ECh. 5.2 - Prob. 5.29ECh. 5.2 - Prob. 5.30ECh. 5.2 - Prob. 5.31ECh. 5.2 - Prob. 5.32ECh. 5.2 - Prob. 5.33ECh. 5.2 - Prob. 5.34ECh. 5.2 - Prob. 5.35ECh. 5.2 - Prob. 5.36ECh. 5.2 - Prob. 5.37ECh. 5.2 - Prob. 5.38ECh. 5.2 - Prob. 5.39ECh. 5.2 - Prob. 5.40ECh. 5.2 - Prob. 5.41ECh. 5.2 - Prob. 5.42ECh. 5.2 - Prob. 5.43ECh. 5.2 - Prob. 5.44ECh. 5.2 - Prob. 5.45ECh. 5.2 - Prob. 5.46ECh. 5.2 - Prob. 5.47ECh. 5.2 - Prob. 5.48ECh. 5.2 - Prob. 5.49ECh. 5.2 - Prob. 5.50ECh. 5.2 - Prob. 5.51ECh. 5.2 - Prob. 5.52ECh. 5.2 - Prob. 5.53ECh. 5.2 - Prob. 5.54ECh. 5.3 - Prob. 5.55ECh. 5.3 - Prob. 5.56ECh. 5.3 - Prob. 5.57ECh. 5.3 - Prob. 5.58ECh. 5.3 - Prob. 5.59ECh. 5.3 - Prob. 5.60ECh. 5.3 - Prob. 5.61ECh. 5.3 - Prob. 5.62ECh. 5.3 - Prob. 5.63ECh. 5.3 - Prob. 5.64ECh. 5.3 - Prob. 5.65ECh. 5.3 - Prob. 5.66ECh. 5.3 - Prob. 5.67ECh. 5.3 - Prob. 5.68ECh. 5.3 - Prob. 5.69ECh. 5.3 - Prob. 5.70ECh. 5.3 - Prob. 5.71ECh. 5.3 - Prob. 5.72ECh. 5.3 - Prob. 5.73ECh. 5.3 - Prob. 5.74ECh. 5.3 - Prob. 5.75ECh. 5.3 - Prob. 5.76ECh. 5 - Prob. 5.77RECh. 5 - Prob. 5.78RECh. 5 - Prob. 5.79RECh. 5 - Prob. 5.80RECh. 5 - Prob. 5.81RECh. 5 - Prob. 5.82RECh. 5 - Prob. 5.83RECh. 5 - Prob. 5.84RECh. 5 - Prob. 5.85RECh. 5 - Prob. 5.86RE
Knowledge Booster
Background pattern image
Statistics
Learn more about
Need a deep-dive on the concept behind this application? Look no further. Learn more about this topic, statistics and related others by exploring similar questions and additional content below.
Recommended textbooks for you
Text book image
MATLAB: An Introduction with Applications
Statistics
ISBN:9781119256830
Author:Amos Gilat
Publisher:John Wiley & Sons Inc
Text book image
Probability and Statistics for Engineering and th...
Statistics
ISBN:9781305251809
Author:Jay L. Devore
Publisher:Cengage Learning
Text book image
Statistics for The Behavioral Sciences (MindTap C...
Statistics
ISBN:9781305504912
Author:Frederick J Gravetter, Larry B. Wallnau
Publisher:Cengage Learning
Text book image
Elementary Statistics: Picturing the World (7th E...
Statistics
ISBN:9780134683416
Author:Ron Larson, Betsy Farber
Publisher:PEARSON
Text book image
The Basic Practice of Statistics
Statistics
ISBN:9781319042578
Author:David S. Moore, William I. Notz, Michael A. Fligner
Publisher:W. H. Freeman
Text book image
Introduction to the Practice of Statistics
Statistics
ISBN:9781319013387
Author:David S. Moore, George P. McCabe, Bruce A. Craig
Publisher:W. H. Freeman
what is Research Design, Research Design Types, and Research Design Methods; Author: Educational Hub;https://www.youtube.com/watch?v=LpmGSioXxdo;License: Standard YouTube License, CC-BY