
Videos
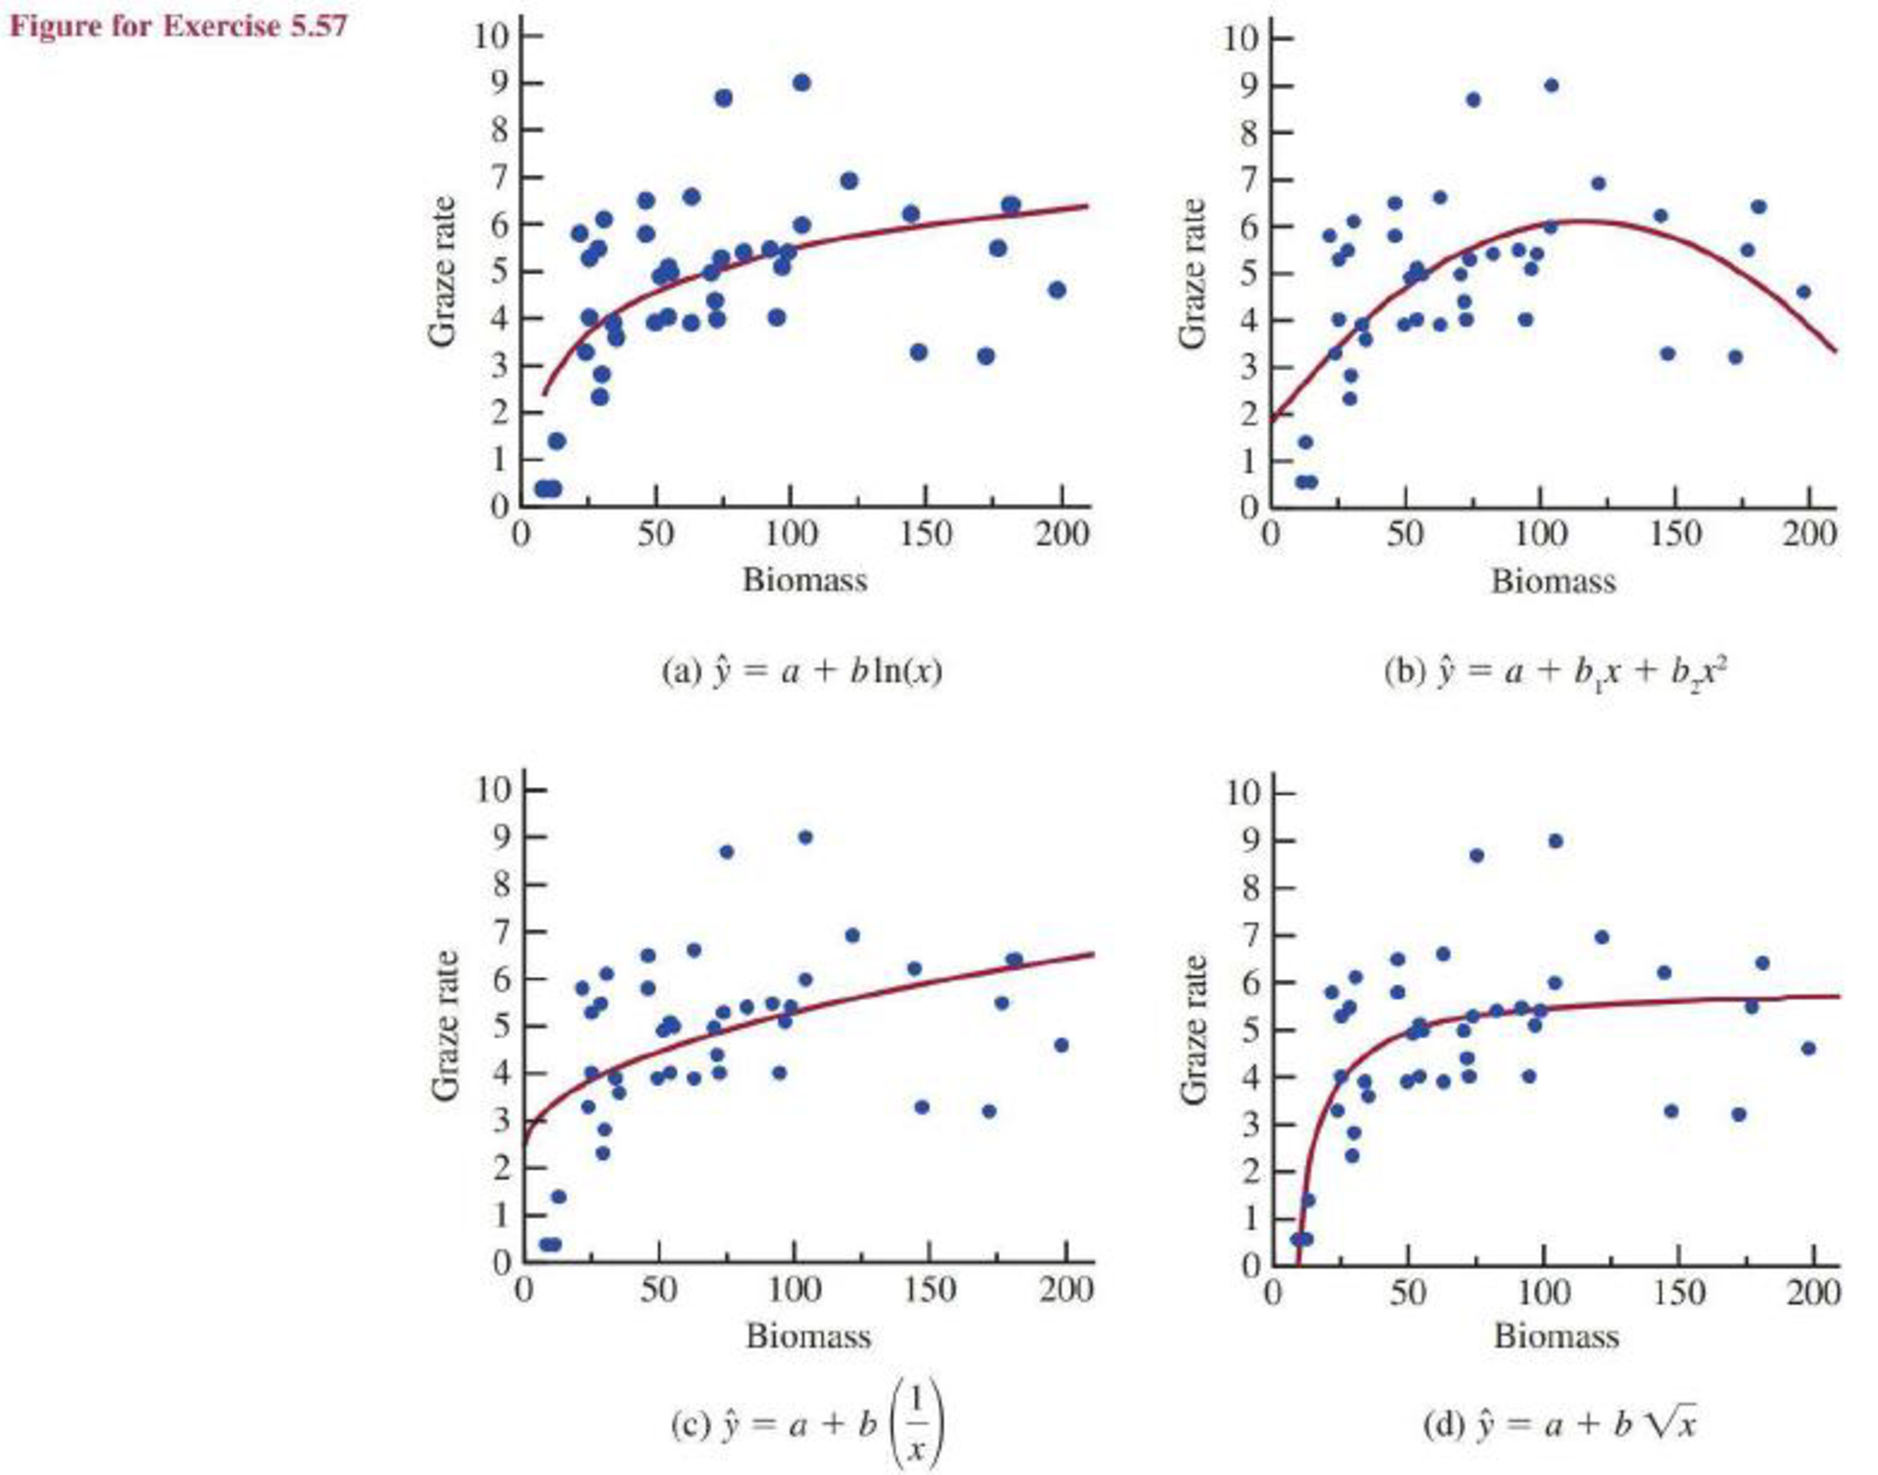
Food intake of grazing animals is limited by the rate grass can be chewed and swallowed, as well as the rate at which food can be digested. The authors of the paper “What Constrains Daily Intake in Thomson’s Gazelles?” (Ecology [1999]: 2338–2347) observed the grazing activity of captive Thomson’s gazelles. They recorded grazing rate (amount of grass eaten, in grams per minute) and biomass of the grazing area (food density, in grams per square meter).
Want to see the full answer?
Check out a sample textbook solution
Chapter 5 Solutions
Bundle: Introduction to Statistics and Data Analysis, 5th + WebAssign Printed Access Card: Peck/Olsen/Devore. 5th Edition, Single-Term


- What does the y -intercept on the graph of a logistic equation correspond to for a population modeled by that equation?arrow_forwardArchaeologists can determine the diets of ancient civilizations by measuring the ratio of carbon-13 to carbon-12 in bones found at burial sites. Large amounts of carbon-13 suggest a diet rich in grasses such as maize, while small amounts suggest a diet based on herbaceous plants. The article "Climate and Diet in Fremont Prehistory: Economic Variability and Abandonment of Maize Agriculture in the Great Salt Lake Basin" (J. Coltrain and S. Leavitt, American Antiquity, 2002:453-485) reports ratios, as a difference from a standard in units of parts per thousand, for bones from individuals in several age groups. The data are presented in the following table. Ratio Age Group (years) 0-11 17.2 18.4 17.9 16.6 19.0 18.3 13.6 13.5 18.5 19.1 19.1 13.4 12-24 14.8 17.6 18.3 17.2 10.0 11.3 10.2 17.0 18.9 19.2 25-45 18.4 13.0 14.8 18.4 12.8 17.6 18.8 179 18.5 17.5 18.3 15.2 10.8 19.8 1 19.2 15.4 13.2 46+ 15.5 18.2 12.7 15.1 18.2 18.0 14.4 10.2 16.7 Construct an ANOVA table. You may give a range for…arrow_forwardAmericium 241 (241 Am) is a radioactive material used in the manufacture of 241 smoke detectors. An article described a study in which 55 beagles were injected with a dose of Am (proportional to each animal's weight). Skeletal retention of 241 Am (in microcuries per kilogram) was recorded for each beagle, resulting in the following data: 0.196 0.3 0.287 0.315 0.335 0.333 0.306 0.353 0.301 0.441 0.337 0.451 0.346 0.243 0.447 0.332 0.408 0.367 0.357 0.304 0.236 0.419 Answer: 0.498 0.448 0.334 0.585 0.292 0.399 0.345 0.32 0.489 0.354 0.428 0.411 0.188 0.299 0.291 0.375 0.303 0.186 0.349 0.318 0.345 0.361 0.324 0.399 0.292 0.19 0.305 0.419 0.393 0.324 0.468 0.412 0.329 By constructing an equal width GFDT (for the given dataset) with six classes and class width (using the given formula in Lecture note II) to be rounded to the nearest hundredth, what proportion of these observations are not less than 0.326? (Type your answer in decimal form, like 0.23)arrow_forward
- Health care workers who use latex gloves with glove powder on a daily basis are particularly susceptible to developing a latex allergy. Each in a sample of 47 hospital employees who were diagnosed with a latex allergy based on a skin-prick test reported on their exposure to latex gloves. Summary statistics for the number of latex gloves used per week are x = 19.7 and s = 12.1. Complete parts (a)-(d). a. Give a point estimate for the average number of latex gloves used per week by all health care workers with a latex allergy. 19.7 b. Form a 95% confidence interval for the average number of latex gloves used per week by all health care workers with a latex allergy. (16.24, 23.16) (Use integers or decimals for any numbers in the expression. Round to two decimal places as needed.) c. Give a practical interpretation of the interval, part (b). OA. One can be 95% confident that the average number of latex gloves used per week by all healthcare workers with latex allergy is greater than the…arrow_forwardHealth care workers who use latex gloves with glove powder on a daily basis are particularly susceptible to developing a latex allergy. Each in a sample of 45 hospital employees who were diagnosed with a latex allergy based on a skin-prick test reported on their exposure to latex gloves. Summary statistics for the number of latex gloves used per week are x = 19.5 and s = 12.1. Complete parts (a) - (d). a. Give a point estimate for the average number of latex gloves used per week by all health care workers with a latex allergy. 19.5 b. Form a 95% confidence interval for the average number of latex gloves used per week by all health care workers with a latex allergy. (Use integers or decimals for any numbers in the expression. Round to two decimal places as needed.)arrow_forwardThe toco toucan, the largest member of the toucan family, possesses the largest beak relative to body size of all birds. This exaggerated feature has received various interpretations, such as being a refined adaptation for feeding. However, the large surface area may also be an important mechanism for radiating heat (and hence cooling the bird) as outdoor temperature increases. The table contains data for beak heat loss, as a percentage of total body heat loss from all sources, at various temperatures in degrees Celsius. The data show that beak heat loss is higher at higher temperatures and that the relationship is roughly linear. [Note: The numerical values in this problem have been modified for testing purposes.] Temperature (°C) 15 16 17 18 19 20 21 22 23 24 25 26 27 Percent heat loss from beak 33 33 33 31 37 44 56 52 45 54 46 55 57arrow_forward
- The toco toucan, the largest member of the toucan family, possesses the largest beak relative to body size of all birds. This exaggerated feature has received various interpretations, such as being a refined adaptation for feeding. However, the large surface area may also be an important mechanism for radiating heat (and hence cooling the bird) as outdoor temperature increases. The table contains data for beak heat loss, as a percentage of total body heat loss from all sources, at various temperatures in degrees Celsius. The data show that beak heat loss is higher at higher temperatures and that the relationship is roughly linear. [Note: The numerical values in this problem have been modified for testing purposes.] Temperature (Co) Percent heat loss from beak 15 32 16 34 17 35 18 33 19 37 20 46 21 55 22 51 23 43 24 52 25 45 26 53 27 58 28 60 29 62 30 62 Adapted from a graph in Glenn J. Tattersall et al., "Heat exchange from the toucan bill…arrow_forwardThe toco toucan, the largest member of the toucan family, possesses the largest beak relative to body size of all birds. This exaggerated feature has received various interpretations, such as being a refined adaptation for feeding. However, the large surface area may also be an important mechanism for radiating heat (and hence cooling the bird) as outdoor temperature increases. The table contains data for beak heat loss, as a percentage of total body heat loss from all sources, at various temperatures in degrees Celsius. The data show that beak heat loss is higher at higher temperatures and that the relationship is roughly linear. [Note: The numerical values in this problem have been modified for testing purposes.] Temperature (oC)(oC) Percent heat loss from beak 1515 3434 1616 3535 1717 3333 1818 3333 1919 3535 2020 4848 2121 5454 2222 5252 2323 4545 2424 5050 2525 4444 2626 5454 2727 5959 2828 6262 2929 6464 3030 6161 Adapted from a graph in…arrow_forwardHealth care workers who use latex gloves with glove powder on a daily basis are particularly susceptible to developing a latex allergy. Each in a sample of 47 hospital employees who were diagnosed with a latex allergy based on a skin-prick test reported on their exposure to latex gloves. Summary statistics for the number of latex gloves used per week are x = 19.3 and s = 12.3. Complete parts (a) - (d). a. Give a point estimate for the average number of latex gloves used per week by all health care workers with a latex allergy. b. Form a 95% confidence interval for the average number of latex gloves used per week by all health care workers with a latex allergy. (Use integers or decimals for any numbers in the expression. Round to two decimal places as needed.) с. Gi a practical interpretation of the interval, part (b). A. One can be 95% confident that latex gloves cause allergies for all who use a number of gloves contained in the interval. B. One can be 95% confident that the average…arrow_forward
- As the world warms, the geographic ranges of species might shift toward cooler areas. Chen et al. (2011) studied recent changes in the highest elevation at which species occur. Typically, higher elevations are cooler than lower elevations. Below are the changes in highest elevation for 20 of the 31 taxa examined in this study, in meters, over the late 1900s and early 2000s. (Taxa included plants, vertebrates, and arthropods.) Positive numbers indicate upward shifts in elevation, and negative numbers indicate shifts to lower elevations. The values are also displayed in the attached graph. What is the standard error of the mean of elevational range shift in these 20 species? (Do not include units, but remember they are meters), and express answer to 3 significant digits) 58.9 7.8 108.6 44.8 19.2 30.5 7.4 39.3 24 62.1 24.3 32.7 65.3 -19.3 -5.2 -2.1 31 88.6 20.7 89 9 8 7 6 5 4 3 2 1 0 Elevation change in m [-19.3, 0.7] (0.7, 20.7] (20.7, 40.7] (40.7, 60.7] (60.7, 80.7] (80.7, 100.7 100.7,…arrow_forwardA medical student at a community college in city Q wants to study the factors affecting the systolic blood pressure of a person (Y). Generally, the systolic blood pressure depends on the BMI of a person (B) and the age of the person A. She wants to test whether or not the BMI has a significant effect on the systolic blood pressure, keeping the age of the person constant. For her study, she collects a random sample of 150 patients from the city and estimates the following regression function: Y= 15.50 +0.90B + 1.10A. (0.48) (0.35) The test statistic of the study the student wants to conduct (Ho: B, =0 vs. H4: B, #0), keeping other variables constant is. (Round your answer to two decimal places.) At the 5% significance level, the student will v the null hypothesis. Keeping BMI constant, she now wants test whether the age of a person (A) has no significant effect or a positive effect on the person's systolic blood pressure. So, the test statistic associated with the one-sided test the…arrow_forwardHealth care workers who use latex gloves with glove powder on a daily basis are particularly susceptible to developing a latex allergy. Each in a sample of 44 hospital employees who were diagnosed with a latex allergy based on a skin-prick test reported on their exposure to latex gloves. Summary statistics for the number of latex gloves used per week are x= 19.4 and s = 11.7. Complete parts (a) - (d). a. Give a point estimate for the average number of latex gloves used per week by all health care workers with a latex allergy. b. Form a 95% confidence interval for the average number of latex gloves used per week by all health care workers with a latex allergy. (Use integers or decimals for any numbers in the expression. Round to two decimal places as needed.) c. Give a practical interpretation of the interval, part (b). O A. One can be 95% confident that latex gloves cause allergies for all who use a number of gloves contained in the interval. O B. One can be 95% confident that the…arrow_forward
 Linear Algebra: A Modern IntroductionAlgebraISBN:9781285463247Author:David PoolePublisher:Cengage Learning
 Glencoe Algebra 1, Student Edition, 9780079039897...AlgebraISBN:9780079039897Author:CarterPublisher:McGraw Hill