
Videos
No tortilla chip lover likes soggy chips, so it is important to find characteristics of the production process that produce chips with an appealing texture. The accompanying data on x = Frying time (in seconds) and y = Moisture content (%) appeared in the paper, “Thermal and Physical Properties of Tortilla Chips as a
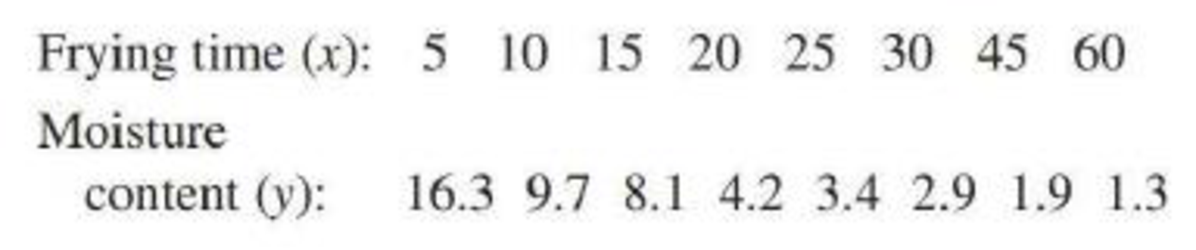
- a. Construct a
scatterplot of these data. Does the relationship between moisture content and frying time appear to be linear? - b. Transform they values using y′ = log(y) and construct a scatterplot of the (x, y′) pairs. Does this scatterplot look more nearly linear than the one in Part (a)?
- c. Find the equation of the least-squares line that describes the relationship between y′ and x.
- d. Use the least-squares line from Part (c) to predict moisture content for a frying time of 35 minutes.

Trending nowThis is a popular solution!

Chapter 5 Solutions
Bundle: Introduction to Statistics and Data Analysis, 5th + WebAssign Printed Access Card: Peck/Olsen/Devore. 5th Edition, Single-Term
Additional Math Textbook Solutions
APPLIED STAT.IN BUS.+ECONOMICS
Stats: Modeling the World Nasta Edition Grades 9-12
An Introduction to Mathematical Statistics and Its Applications (6th Edition)
Introductory Statistics (2nd Edition)
Business Analytics
Fundamentals of Statistics (5th Edition)


- For the following table of data. x 1 2 3 4 5 6 7 8 9 10 y 0 0.5 1 2 2.5 3 3 4 4.5 5 a. draw a scatterplot. b. calculate the correlation coefficient. c. calculate the least squares line and graph it on the scatterplot. d. predict the y value when x is 11.arrow_forwardThe article "Characteristics and Trends of River Discharge into Hudson, James, and Ungava Bays, 1964-2000" (S. Dery, M. Stieglitz, et al., Journal of Climate, 2005:2540-2557) presents measurements of discharge rate x (in kmlyr) andpeakflow y (in m/s) for 42 rivers that drain into the Hudson, James, and Ungava Bays. The data are shown in the following table: Discharge Peak Flow 94.24 4110.3 66.57 4961.7 59.79 10275.5 48.52 6616.9 40.00 7459.5 32.30 2784.4 31.20 3266.7 30.69 4368.7 26.65 1328.5 22.75 4437.6 21.20 1983.0 20.57 1320.1 19.77 1735.7 18.62 1944.1 17.96 3420.2 17.84 2655.3 16.06 3470.3 1561.6 14.69 11.63 869.8 11.19 936.8 11.08 1315.7 10.92 1727.1 9.94 768.1 7.86 483.3arrow_forwardThis dataset includes measurements of soil temperature and soil respiration at three places along the riverbank (upper, mid, and lower; the upper site is far away from water and the lower site is close to water). Please help describe and interpret the results below:arrow_forward
- An article in the Journal of Environmental Engineering (1989, Vol. 115(3), pp. 608–619) reported the results of a study on the occurrence of sodium and chloride in surface streams in central Rhode Island. The following data are chloride concentration y (in milligrams per liter) and roadway area in the watershed x (in percentage).arrow_forwardWrinkle recovery angle and tensile strength are the two most important characteristics for evaluating the performance of crosslinked cotton fabric. An increase in the degree of crosslinking, as determined by ester carboxyl band absorbance, improves the wrinkle resistance of the fabric (at the expense of reducing mechanical strength). The accompanying data on x = absorbance and y = wrinkle resistance angle was read from a graph in the paper "Predicting the Performance of Durable Press Finished Cotton Fabric with Infrared Spectroscopy".t x 0.115 0.126 0.183 0.246 0.282 0.344 0.355 0.452 0.491 0.554 0.651 y 334 342 355 363 365 372 381 400 392 412 420 Here is regression output from Minitab: Predictor Constant absorb S = 3.60498 Coef 321.878 156.711 SOURCE Regression Residual Error Total R-Sq= 98.5% DF SE Coef 2.483 6.464 1 9 10 SS 7639.0 117.0 7756..0 T 129.64 24.24 P 0.000 0.000. R-Sq (adj) 98.3% MS 7639.0 13.0 F 587.81 (a) Does the simple linear regression model appear to be appropriate?…arrow_forwardThe depth of wetting of a soil is the depth to which water content will increase owing to extemal factors. The article "Discussion of Method for Evaluation of Depth of Wetting in Residential Areas" (J. Nelson, K. Chao, and D. Overton, Journal of Geotechnical and Geoenvironmental Engineering, 2011:293-296) discusses the relationship between depth of wetting beneath a structure and the age of the structure. The article presents measurements of depth of wetting, in meters, and the ages, in years, of 21 houses, as shown in the following table. Age Depth 7.6 4 4.6 6.1 9.1 3 4.3 7.3 5.2 10.4 15.5 5.8 10.7 4 5.5 6.1 10.7 10.4 4.6 7.0 6.1 14 16.8 10 9.1 8.8 Compute the least-squares line for predicting depth of wetting (y) from age (x). b. Identify a point with an unusually large x-value. Compute the least-squares line that results from deletion of this point. Identify another point which can be classified as an outlier. Compute the least-squares line that results from deletion of the outlier,…arrow_forward
- Pls. help me in my stat about CORRELATION ANALYSIS, SIMPLE REGRESSION ANALYSIS AND PATH ANALYSIS IN Rarrow_forwardThe article "Lead Dissolution from Lead Smelter Slags Using Magnesium Chloride Solutions" (A. Xenidis, T. Lillis, and I. Hallikia, The AusIMM Proceedings, 1999:37-14) discusses an investigation of leaching rates of lead in solutions of magnesium chloride. The data in the following table (read from a graph) present the percentage of lead that has been extracted at various times (in minutes). Time (t) 4 8 16 30 60 120 Percent extracted (v) |1.2 1.6 2.3 2.8 3.6 4.4 a. The article suggests fitting a quadratic model y = Bo + B,t + Bz² + ɛ to these data. Fit this model, and compute the standard deviations of the coefficients. b. The reaction rate at time t is given by the derivative dy/dt = B, + 2B,t. Estimate the time at which the reaction rate will be equal to 0.05. c. The reaction rate at t = Oisequal to B1. Find a 95% confidence interval for the reaction rate at t = 0. d. Can you conclude that the reaction rate is decreasing with time? Explain.arrow_forwardA state's park system statistical report for the 2014/2015 fiscal year gave the accompanying data on x = amount of money collected in user fees (in thousands of dollars) and y = operating cost (in thousands of dollars) for nine state parks in a certain district. 17 74 363 811 3,618 380 1,363 M 33 239 427 752 500 1,054 734 760 4000 (a) Construct a scatterplot of these data. 3000 User Fees Operating Costs (thousands of dollars) (thousands of dollars) 2000 1000 USE SALT 200 Need Help? 400 Submit Answer 600 99 Describe any interesting features of the scatterplot. There is a positive Read It 2,227 1,636 800 Watch It y 4000 3000 LILL 2000 1000 0 200 400 y 4000 3000 2000 1000 0 0 (b) Find the equation of the least squares line. (Round your answers to four decimal places.) ŷ = X + |× )x 200 400 linear relationship between user fees collected and operating costs. (c) Is the slope of the least squares line positive or negative? Is this consistent with your description of the scatterplot in part…arrow_forward
- Turbid water is muddy or cloudy water. Sunlight is necessary for most life forms; thus turbid water is considered a threat to wetland ecosystems. Passive filtration systems are commonly used to reduce turbidity in wetlands. Suspended solids are measured in mg/l. Is there a relation between input and output turbidity for a passive filtration system and, if so, is it statistically significant? At a wetlands environment in Illinois, the inlet and outlet turbidity of a passive filtration system have been measured. A random sample of measurements are shown below. (Reference: EPA Wetland Case Studies.) Reading 1 2 3 4 5 6 7 8 9 10 11 12 Inlet (mg/l) 59.1 25.7 70.5 71.0 37.6 43.5 13.1 24.2 16.7 49.1 67.6 31.7 Outlet (mg/l) 18.2 14.3 15.3 17.5 13.1 8.0 4.1 4.4 4.3 5.8 16.3 7.1 Use a 1% level of significance to test the claim that there is a monotone relationship (either way) between the ranks of the inlet readings and outlet readings. (a) Rank-order the inlet readings using 1 as…arrow_forwardTurbid water is muddy or cloudy water. Sunlight is necessary for most life forms; thus turbid water is considered a threat to wetland ecosystems. Passive filtration systems are commonly used to reduce turbidity in wetlands. Suspended solids are measured in mg/l. Is there a relation between input and output turbidity for a passive filtration system and, if so, is it statistically significant? At a wetlands environment in Illinois, the inlet and outlet turbidity of a passive filtration system have been measured. A random sample of measurements are shown below. (Reference: EPA Wetland Case Studies.) Reading Inlet (mg/l) Outlet (mg/l) 3 4 5 6 7 8 9 10 11 12 31.6 86.9 87.0 12.0 45.4 43.3 32.3 77.7 71.7 85.9 64.9 80.1 3.3 14.2 16.8 5.7 4.6 6.2 3.4 7.7 8.0 7.4 8.7 14.3 Use a 1% level of significance to test the claim that there is a monotone relationship (either way) between the ranks of the inlet readings and outlet readings. (a) Rank-order the inlet readings using 1 as the largest data…arrow_forward
 Algebra & Trigonometry with Analytic GeometryAlgebraISBN:9781133382119Author:SwokowskiPublisher:Cengage
 Calculus For The Life SciencesCalculusISBN:9780321964038Author:GREENWELL, Raymond N., RITCHEY, Nathan P., Lial, Margaret L.Publisher:Pearson Addison Wesley,