
Concept explainers
Videos
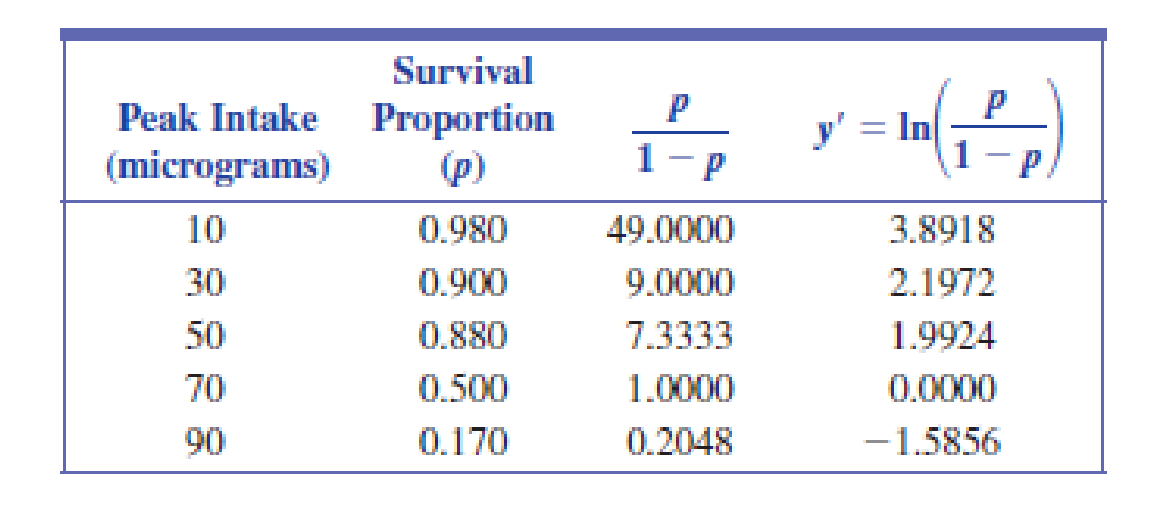
Anabolic steroid abuse has been increasing despite increased press reports of adverse medical and psychiatric consequences. Medical researchers studied the potential for addiction to testosterone in hamsters (Neuroscience [2004]: 971–981). Hamsters were allowed to self-administer testosterone over a period of days, resulting in the death of some of the animals.
The data below show the proportion of hamsters surviving versus the peak self-administration of testosterone (μg). Fit a logistic regression equation and use the equation to predict the

Trending nowThis is a popular solution!

Chapter 5 Solutions
Bundle: Introduction to Statistics and Data Analysis, 5th + WebAssign Printed Access Card: Peck/Olsen/Devore. 5th Edition, Single-Term


- What does the y -intercept on the graph of a logistic equation correspond to for a population modeled by that equation?arrow_forwardThe following table contains statistics from a logistic regression analysis for a study on intravenous drug use among high school students in United States. Drug use is characterized as a dichotomous variable, where 1 indicates that an individual has injected drugs within the past year and 0 that he or she has not. Factors that might be related to drug use are instruction about the HIV in school (1 represents "had HIV education" and 0 represents "did not have HIV education"), age of the student (in years), and gender (1 represents male and 0 represents female). Statistics in the table are estimated coefficients of the logistic regression model and p-values for testing the significance of the coefficients. Choose proper answers using statistics in the following table. (THERE MAY BE MORE THAN ONE CORRECT ANSWER) Variable Coefficient p-value Intercept (Constant) -0.164 0.078 HIV instruction 0.019 0.928 Age 0.064 0.036 Gender 1.032 0.014…arrow_forwardUniversal bank launched a campaign to promote personal loans to its customers. In order to better understand customers' decision, the bank built a logistic regression model to predict the probability of a customer accepting personal loan offered by the bank. Define p= P(Personal. Loan = 1) odds = The model with estimated coefficients is: log(odds) = -12.6806 – 0.0369 x Age + 0.0491 x Experience + 0.0613 x Income + 0.5435 x Family + 0.2166 x CCAvg + 4.2681 x EducationGraduate + 4.4408 x EducationProfessional + 0.0015 x Mortgage – 1.1457 x Securities. Account + 4.5856 x CD. Account – 0.8588 x Online – 1.2514 x CreditCard Descriptions of the variables in the model: Personal.Loan: Coded as 1 if customer responded to the last personal loan campaign Age: Customer's age in completed years Experience: Number of years professional experience Income: Annual incomes of the customer (in $000s) Family: Family size of the customer CCAvg: Average spending on credit cards per month (in $000s)…arrow_forward
- The National Survey of Drug Use and Health is a large annual cross-sectional survey of drug use in the United States. Using data from this survey, researchers wanted to assess the relationship between region in the country (Northeast, Midwest, South, and West) and past-month marijuana use among 18-25-year-olds. They obtained the following logistic regression model from the data: 1)What are the log odds of past-month marijuana use among 18-25-year-olds in the Midwest? 2)What is the probability of past-month marijuana use among 18-25-year-olds in the Northeast? 3)The odds of past-month marijuana use for 18-25-year-olds in the South is _______ times the odds of past-month marijuana use for 18-25-year-olds in the Northeast.arrow_forwardTo determine characteristics associated with Y = whether a cancer patient achieved remission (1 = yes), a study used logistic regression. The most important explanatory variable was a labeling index (LI) that measures proliferative activity of cells after a patient receives an injection of tritiated thymidine. It represents the percentage of cells that are “labeled.” Table 4.8 shows the grouped data. Software reports Table 4.9 for a logistic regression model using LI to predict π = P (Y = 1). A. Show how software obtained π ̂ = 0.068 when LI = 8. B. Show that π ̂ = 0.50 when LI = 26.0 D. The lower quartile and upper quartile for LI are 14 and 28. Show that π ̂ increases by 0.42, from 0.15 to 0.57, between those values. E. When LI increases by 1, show the estimated odds of remission multiply by 1.16arrow_forwardFor a logistic regression looking at the log-odds of obesity among 20 to 70 year olds, age was included as a predictor. Age was recorded into categories: 20-29, 30-39. 40-49, 50-59, and 60-70. Given it is an ordinal variable, the statistician acknowledged that age could be included in the logistic regression model as continuous or categorical. Suppose that the statistician used loglikelihood ratio test of nested models to examine whether age could be treated as continuous. First, what is the null hypothesis? O Age is not a predictor of obesity Age is appropriate as a continuous variable O Age is appropriate as a categorical variable O Age is a predictor of obesityarrow_forward
- Investigators want to assess the association between initial serum cholesterol levels (mg/100ml) and presence of coronary artery disease (response), adjusting for age and body mass index (BMI). What is the most appropriate method for assessing this association? 1.Multiple Linear Regression 2.Correlation 3.ANOVA 4.Multiple Logistic Regression 5. Chi-Squared Test Can you tell me why please?arrow_forwardAccording to human capital theory, a person’s earning is linked to her level of education – there is a relationship between workers income and years of education. Using data from the Labour Force Survey, a researcher found the following regression results for earnings on intercept, years of education, experience, and experience squared: Earnings = 5.24 + 0.035 educ + 0.165 exper – 0.003 exper2 (2.45) (0.012) (0.031) (0.001) Construct a 95% confidence interval for the effect of years of education on earnings ? 2. Consider an individual with 8 years of experience. What would you expect to be the return to two (2) additional years of experience (the effect on earnings)? 3. According to economic theory,…arrow_forwardThis problem is inspired by a study of the "gender gap" in earnings in top corporate jobs [Bertrand and Hallock (2001)]. The study compares total compensation among top executives in a large set of U.S. public corporations in the 1990s. (Each year these publicly traded corporations must report total compensation levels for their top five executives.) Let Female be an indicator variable that is equal to 1 for females and 0 for males A regression of the logarithm of earnings onto Female yields In(Earnings) = 6.42 -0 45Female, SER=2.87 (0 01) (0.05) Calculate the average hourly earnings for top male and female executives. The hourly earnings for top male executives is $ per hour. (Round your response to two decimal places.) The hourly earnings for top female executives is $per hour. (Round your response to two decimal places) What is the estimated average difference between earnings of top male executives and top female executives? The estimated average difference between earnings of top…arrow_forward
- The market research department of a soft drink manufacturer is investigating the effectiveness of a price discount coupon on the purchase of a two-liter beverage product. A sample of 5500 customers was given coupons for varying-price discounts between 5 and 25 cents. The response variable was the number of coupons in each price discount category redeemed after one month. The data is in the picture. a. Fit a logistic regression model to the data. Use a simple linear regression model as the structure for the linear predictor.b. Does the model deviance indicate that the logistic regression model from part a is adequate?c. Draw a graph of the data and the fitted logistic regression model.d. Expand the linear predictor to include a quadratic term. Is there any evidence that this quadratic term is required in the model?arrow_forwardA researcher is using a panel data set on n = 1000 workers over T = 10 years (from 2001 through 2010) that contains the workers' earnings, gender, education, and age. The researcher is interested in the effect of education on earnings. Suppose you run a regression of earnings on person-specific and time-specific control variables. Can this regression be used to estimate the effect of gender on an individual's earnings or the effect of the national unemployment rate on an individual's earnings? A. Neither effect can be estimated using this regression. B. It can be used to estimate the effect of both gender and the national unemployment rate on an individual's earnings C. It can be used to estimate the effect of gender on an individual's earnings, but not the effect of the national unemployment rate on an individual's earnings. D. It can be used to estimate the effect of the national unemployment rate on an individual's earnings, but not the effect of gender on an individual's earnings.arrow_forwardExplain which characteristic of the STA leads to a consideration of a logistic model as opposed to a linear regression mode.arrow_forward
 Calculus For The Life SciencesCalculusISBN:9780321964038Author:GREENWELL, Raymond N., RITCHEY, Nathan P., Lial, Margaret L.Publisher:Pearson Addison Wesley,
 Glencoe Algebra 1, Student Edition, 9780079039897...AlgebraISBN:9780079039897Author:CarterPublisher:McGraw Hill