
Concept explainers
Videos
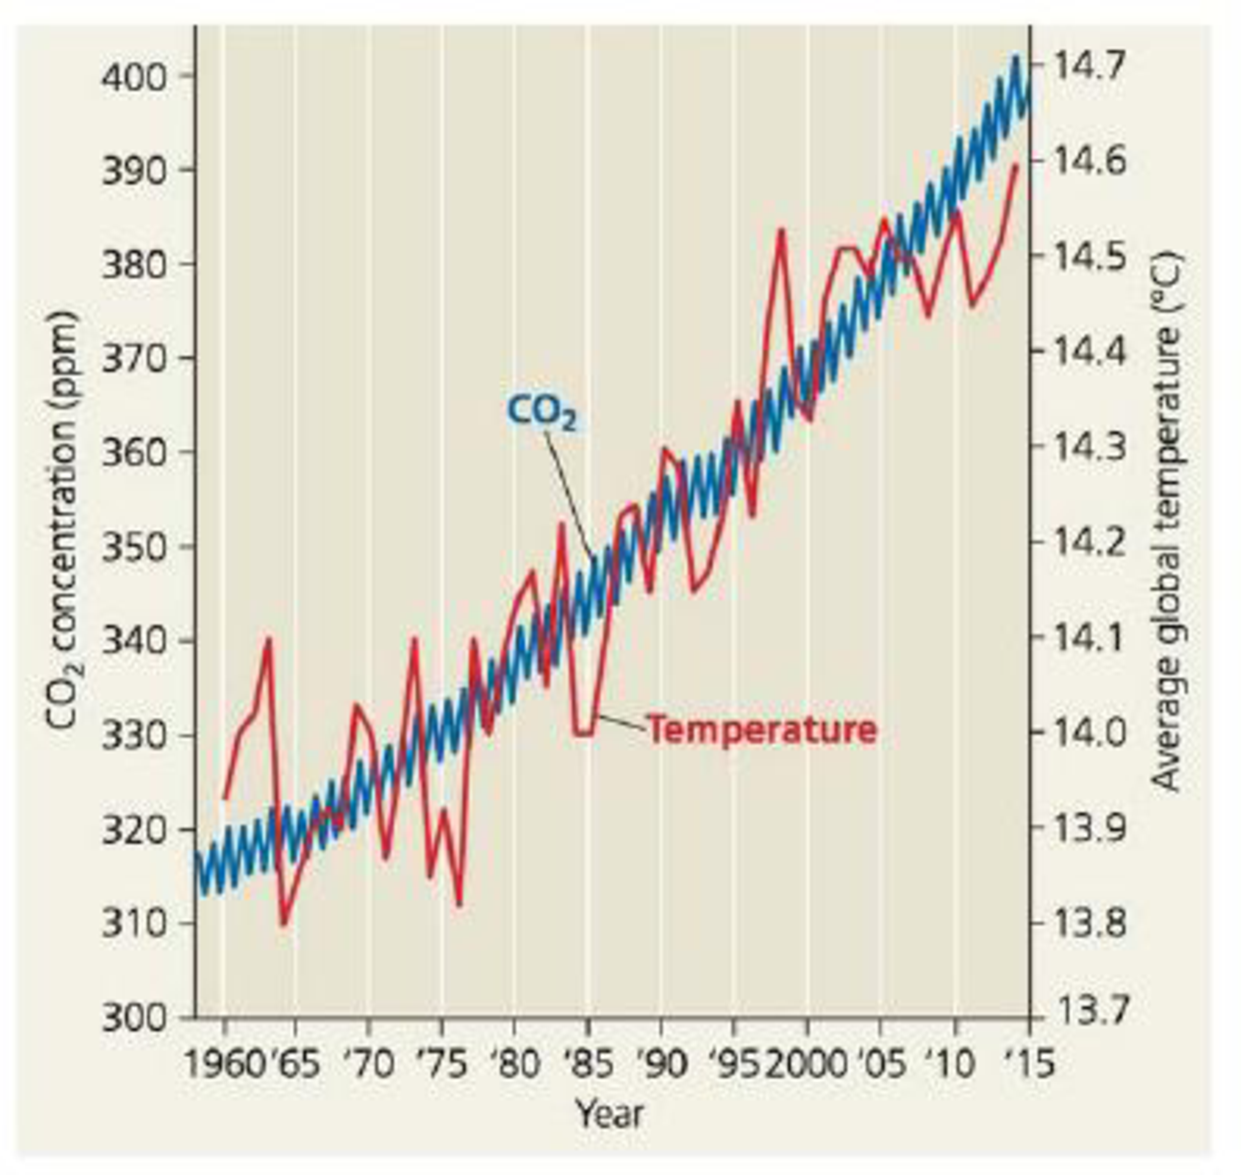
SCIENTIFIC INQUIRY (a) Estimate the average CO2. concentration in 1975 and in 2012 using data provided in Figure 56.28. (b) On average, how rapidly did CO2 concentration increase (ppm/yr) from 1975 to 2012? (c) Estimate the approximate CO2 concentration in 2100, assuming that the C02 concentration continues to rise as fast as it did from 1975 to 2012. (d) Draw a graph of average C02 concentration from 1975 to 2012 and then use a dashed line to extend the graph to the year 2100. (e) Identify the ecological factors and human decisions that might influence the actual rise in CO2. concentration. (e) Discuss how additional scientific data could help societies predict this value.
Figure 56.28 Increase in atmospheric carbon dioxide concentration at Mauna Loa, Hawaii, and average global temperatures. Aside from normal seasonal fluctuations, the CO2 concentration (blue curve) increased steadily from 1958 to 2015. Though average global temperatures (red curve) fluctuated a great deal over the same period, there is a clear warming trend.
Want to see the full answer?
Check out a sample textbook solution
Chapter 56 Solutions
Campbell Biology (11th Edition)


- Model/diagram the sources and sinks of carbon in the global ecosystem. You will need to create TWO models/diagrams of the sources and sinks of carbon. In the first model diagram the sources and sinks of carbon in a natural, pre-industrial landscape. In the second model, diagram the sources and sinks of carbon in a landscape altered by human activity and industry. Finally, write a few short sentences on what you would expect the atmospheric levels of CO2 to be in each model and why they would or would not be similar.arrow_forwardPropose a reason why the CO2 fluxes are greater for terrestrial biological activity than for marine biological activity.arrow_forwardglobal CO2 levels in the past million years were at or higher concentration that they are today (i.e. over 407 ppm). True or Falsearrow_forward
- which is the currently CO2 content of Earth'satmosphere is approximatelyA. 1%.B. 20%.C. 25 ppm.D. 330 ppm.E. 600 ppm.arrow_forwardWhat % of CO2 is absorbed by the oceans from burning fossil fuels?arrow_forwardThe current concentration of CO2 in the atmosphere is about 415 ppmv. It has been estimated that annual anthropogenic additions to the atmosphere are about 30 gigatonnes (Gt), of which about 15 Gt are removed into oceans and the terrestrial environment. a) Use these values to estimate the yearly net increase in atmospheric carbon dioxide mixing ratio, in ppmv. (note that 1 Gt = 1015g)arrow_forward
- Global Carbon Dioxide Cycling Expressed as Human Equivalents If 3 x 10¹⁴ kg of CO2 are cycled through the biosphere annually, how many human equivalents (70-Kg people composed of 18% carbon by weight) could be produced each year from this amount of CO2?arrow_forwardMercury Emissions by Continent By weight, coal does not contain much mercury, but we burn a lot of it. Several industries besides coal-fired power plants contribute substantially to atmospheric mercury pollution. FIGURE 2.13 shows mercury emissions by industry from different regions of the world in 2010. FIGURE 2.13 Global mercury emissions by sector, 2010. Which region emitted the most mercury from burning fossil fuels?arrow_forwardMercury Emissions by Continent By weight, coal does not contain much mercury, but we burn a lot of it. Several industries besides coal-fired power plants contribute substantially to atmospheric mercury pollution. FIGURE 2.13 shows mercury emissions by industry from different regions of the world in 2010. FIGURE 2.13 Global mercury emissions by sector, 2010. Which industry tops the list of mercury emitters? Which industry is next on the list?arrow_forward
- The recent increase in atmospheric CO2 concentration is mainly a result of an increase in a. plant growth. b. the absorption of heat radiating from Earth. c. the burning of fossil fuels and wood. d. cellular respiration by the increasing human population.arrow_forwardWhat gas is a human-made pollutant in the lower (surface) atmosphere but a natural and beneficial gas in the stratosphere? (a) CO2 (b) CH4 (c) O3 (d) CFCs (e) N Oarrow_forwardWhat is the trend of CO2 cons in recent years?arrow_forward
 Biology: The Unity and Diversity of Life (MindTap...BiologyISBN:9781337408332Author:Cecie Starr, Ralph Taggart, Christine Evers, Lisa StarrPublisher:Cengage Learning
 BiochemistryBiochemistryISBN:9781305577206Author:Reginald H. Garrett, Charles M. GrishamPublisher:Cengage Learning