
INTEGRATED PRINC.OF ZOOLOGY(LL)(FD)
17th Edition
ISBN: 9781260704310
Author: HICKMAN
Publisher: MCGRAW-HILL CUSTOM PUBLISHING
expand_more
expand_more
format_list_bulleted
Concept explainers
Videos
Textbook Question
Chapter 6, Problem 16RQ
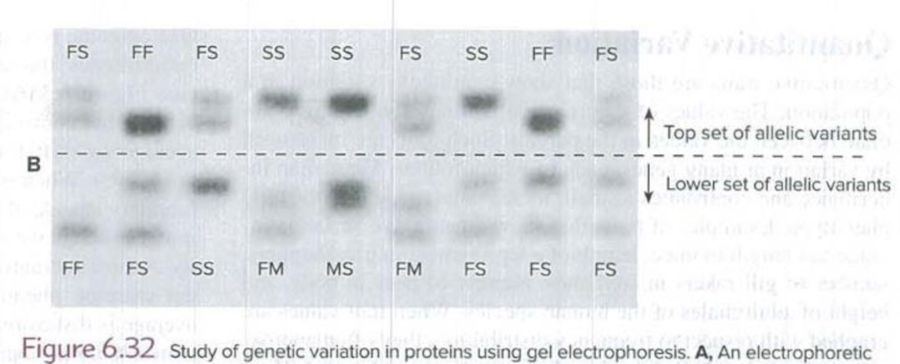
Using the data shown in Figure 6.32, calculate the frequencies of the alleles in the top set of bands and in the lower set of bands.
Expert Solution & Answer
Want to see the full answer?
Check out a sample textbook solution
Students have asked these similar questions
Using the example of pea color in Mendel’s pea plants, can you devise equations to determine the allele frequencies of A and a from the genotype frequencies of aa, Aa, and AA?
In radish the effect of the alleles producing the red long variety is incompletely dominant over the effect of the alleles producing the white round variety; the heterozygote being purple oval.
(Answer should be written in ratios only, for example: 1:2 or 1:2:3 or 1:2:3:4, etc... DO NOT place any space between numbers and colons. All answers must be in the lowest terms.)What genotypic ratio would you expect in a cross between radishes that are:Red, long x white, round?
GENOTYPIC Ratio:
In radish the effect of the alleles producing the red long variety is incompletely dominant over the effect of the alleles producing the white round variety; the heterozygote being purple oval.
(Answer should be written in ratios only, for example: 1:2 or 1:2:3 or 1:2:3:4, etc... DO NOT place any space between numbers and colons. All answers must be in the lowest terms.)
What phenotypic ratio would you expect in a cross between radishes that are:
Red, long x white, round?
Chapter 6 Solutions
INTEGRATED PRINC.OF ZOOLOGY(LL)(FD)
Ch. 6 - Briefly summarize Lamarcks concept of the...Ch. 6 - What is uniformitarianism? How did it influence...Ch. 6 - Why was the Beagles journey so important to...Ch. 6 - What was the key idea contained in Malthuss essay...Ch. 6 - Explain how each of the following contribute(s) to...Ch. 6 - How do modern evolutionists view the relationship...Ch. 6 - What are the important differences between the...Ch. 6 - What are reproductive barriers? How do premating...Ch. 6 - Under what conditions is sympatric speciation...Ch. 6 - What is the main evolutionary lesson provided by...
Ch. 6 - How is the observation of sporting mutations in...Ch. 6 - What does the theory of punctuated equilibrium...Ch. 6 - Describe the observations and inferences that...Ch. 6 - Identify the random and nonrandom components of...Ch. 6 - Describe some recurring criticisms of Darwins...Ch. 6 - Using the data shown in Figure 6.32, calculate the...Ch. 6 - Assume that you are sampling a trait in animal...Ch. 6 - If after studying a population for a trait...Ch. 6 - Explain why genetic drift is more powerful in...Ch. 6 - Describe how the effects of genetic drift and...Ch. 6 - Is it easier for selection to remove a deleterious...Ch. 6 - Distinguish between microevolution and...Ch. 6 - Explain why the evidence supporting Darwins theory...
Knowledge Booster


Learn more about
Need a deep-dive on the concept behind this application? Look no further. Learn more about this topic, biology and related others by exploring similar questions and additional content below.Similar questions
- Consider a locus with two alleles, A and a. If the frequency of AA is 0.30, what is the frequency of A under Hardy-Weinberg?arrow_forwardWhat is the mathematical expression for the genetic equilibrium for genes with two alleles? Is this statistical distribution the same as the statistical distribution of the respective phenotypes?arrow_forward****Note for question 1 - you have been given the frequency of the two alleles (dominant and recessive = p + q=1) and you are using those allele frequencies to calculate the genotype frequencies. p2 + 2pq + p2arrow_forward
- This is a classic data set on wing coloration in the scarlet tiger moth (Panaxia dominula). Coloration in this species had been previously shown to behave as a single-locus, two-allele system with incomplete dominance. Data for 1612 individuals are given below: White-spotted (AA) =1469 Intermediate (Aa) = 138 Little spotting (aa) =5 Calculate the following frequencies: A=, a=, AA=, Aa=, aa=arrow_forwardThe phenotypic data below are the shoot lengths of 25 F1 and 25 F2 rice plants at seedling stage, produced from the cross of IR29 and Hasawi rice varieties. The mean lengths of the shoot from IR29 and Hasawi are 23.1 cm and 46.7 cm, respectively. Tabulate and plot the frequency distributions of the F1 and F2 generations. Use the formulas below in the computations. From each distribution calculate the mean, the variance, and the standard error of the mean. Round off answers to two decimal places. What is the main difference between F1 and F2 distributions?arrow_forwardFigure 19-11 shows the expected distributions for thethree genotypic classes if the B locus is a QTL affectingthe trait value.a. As drawn, what is the dominance/additive (D/A)ratio?b. How would you redraw this figure if the B locus hadno effect on the trait value?c. How would the positions along the x-axis of thecurves for the different genotypic classes of the B locuschange if D/A = 1.0?arrow_forward
- Assuming there are only two alleles at a given locus, if the frequency of one allele is 0.3, what is the frequency of the other allele?arrow_forwardThere are two types of alleles: Type B1 and Type B2 (In total there are 10) Type B1 has 6 Type B2 has 4 Question: What is the probability of an individual in the offspring generation being homozygous [p^2] for B1? What is the probability of an individual in the offspring generation being homozygous [q^2] for B2? What is the probability of an individual in the offspring gen being heterozygous[2pq]?arrow_forwardIn your F2 light treatment vial, you observe the following data: 5 white-eyed males, 18 wild-type males, 7 white-eyed females, and 10 wild-type females. What is the white-eyed allele frequency in this generation? Leave your answer as a decimal. Give the explanation also.arrow_forward
- Using the HardyWeinberg Law in Human Genetics Suppose you are monitoring the allelic and genotypic frequencies of the MN blood group locus (see Question 2 for a description of the MN blood group) in a small human population. You find that for 1-year-old children, the genotypic frequencies are MM = 0.25, MN = 0.5, and NN = 0.25, whereas the genotypic frequencies for adults are MM = 0.3, MN = 0.4, and NN = 0.3. a. Compute the M and N allele frequencies for 1-year-olds and adults. b. Are the allele frequencies in equilibrium in this population? c. Are the genotypic frequencies in equilibrium?arrow_forwardOrchids come in an amazing variety of colours. Scientists found that cloned Cattleya orchids have a phenotypic variance of 14, while wild Cattleya orchids have a phenotypic variance of 29. What is the broad-sense heritability of these orchids?arrow_forwardUsing the observed counts for each genotype, how do you find the expected values with those numbers and the frequencies?arrow_forward
arrow_back_ios
SEE MORE QUESTIONS
arrow_forward_ios
Recommended textbooks for you
 Human Heredity: Principles and Issues (MindTap Co...BiologyISBN:9781305251052Author:Michael CummingsPublisher:Cengage Learning
Human Heredity: Principles and Issues (MindTap Co...
Biology
ISBN:9781305251052
Author:Michael Cummings
Publisher:Cengage Learning
Genetic Variation and Mutation | 9-1 GCSE Science Biology | OCR, AQA, Edexcel; Author: SnapRevise;https://www.youtube.com/watch?v=bLP8udGGfHU;License: Standard YouTube License, CC-BY