Introduction to the Practice of Statistics
9th Edition
ISBN: 9781319013387
Author: David S. Moore, George P. McCabe, Bruce A. Craig
Publisher: W. H. Freeman
bartleby

Videos

Question
Book Icon
Chapter 6.1, Problem 13E

Section 1

To determine

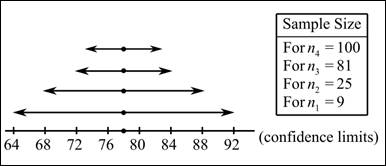
To graph: The diagram which shows the effect of sample size on the width of a 95% interval.

Section 1

Expert Solution
Check Mark

Explanation of Solution

Calculation: The confidence interval for the population mean μ at a significance level of "α" can be calculated by using the following formula:

Lower bound = x¯m=x¯Zα/2×σn

And,

Upper bound = x¯+m=x¯+Zα/2×σn

Where,

m=Margin of errorx¯=Sample meanσ=Standard deviationn=Sample size

Here, Zα/2 is the critical value which is obtained from standard normal table. The critical value is 1.96 at 5% level of significance. The confidence interval for population mean when the sample size is n1=9 can be calculated as:

Lower bound = x¯Zα2×σn1=781.96×209=7813.06=64.93

And,

Upper bound =x¯+Zα2×σn1=78+1.96×209=78+13.06=91.07

Therefore, the required confidence interval is (64.93,91.07). The confidence interval when n2=25:

Lower bound = x¯Zα2×σn2=781.96×2025=787.84=70.16

And,

Upper bound = x¯+Zα2×σn2=78+1.96×2025=78+7.84=85.84

Therefore, the required confidence interval is (70.16,85.84). The confidence interval when n3=81:

Lower bound = x¯Zα2×σn3=781.96×2081=784.36=73.64

And,

Upper bound =x¯=Zα2×σn3=78+1.96×2081=78+4.36=82.36

Therefore, the required confidence interval is (73.64,82.36). The confidence interval when n4=100:

Lower bound = x¯Zα2×σn4=781.96×20100=783.92=74.08

And,

Upper bound =x¯+Zα2×σn4=78+1.96×20100=78+3.92=81.92

Therefore, the required confidence interval is (74.08,81.92).

Graph:

Introduction to the Practice of Statistics, Chapter 6.1, Problem 13E

Section 2

To determine

To explain: The results.

Section 2

Expert Solution
Check Mark

Answer to Problem 13E

Solution: The width of the confidence interval reduces due to hike in the sample size.

Explanation of Solution

The growth of the sample size leads to a fall in the confidence interval because the margin of error is directly proportional to the sample size which means that if the sample size increases the margin of error decreases. This leads to reduction in the width of the confidence interval.

Want to see more full solutions like this?

Subscribe now to access step-by-step solutions to millions of textbook problems written by subject matter experts!

Chapter 6 Solutions

Introduction to the Practice of Statistics

Ch. 6.1 - Prob. 11UYKCh. 6.1 - Prob. 12ECh. 6.1 - Prob. 13ECh. 6.1 - Prob. 14ECh. 6.1 - Prob. 15ECh. 6.1 - Prob. 16ECh. 6.1 - Prob. 17ECh. 6.1 - Prob. 18ECh. 6.1 - Prob. 19ECh. 6.1 - Prob. 20ECh. 6.1 - Prob. 21ECh. 6.1 - Prob. 22ECh. 6.1 - Prob. 23ECh. 6.1 - Prob. 24ECh. 6.1 - Prob. 25ECh. 6.1 - Prob. 26ECh. 6.1 - Prob. 27ECh. 6.1 - Prob. 28ECh. 6.1 - Prob. 29ECh. 6.1 - Prob. 30ECh. 6.1 - Prob. 31ECh. 6.1 - Prob. 32ECh. 6.1 - Prob. 33ECh. 6.1 - Prob. 34ECh. 6.1 - Prob. 35ECh. 6.1 - Prob. 36ECh. 6.1 - Prob. 37ECh. 6.2 - Prob. 38UYKCh. 6.2 - Prob. 39UYKCh. 6.2 - Prob. 40UYKCh. 6.2 - Prob. 41UYKCh. 6.2 - Prob. 42UYKCh. 6.2 - Prob. 43UYKCh. 6.2 - Prob. 44UYKCh. 6.2 - Prob. 45UYKCh. 6.2 - Prob. 46UYKCh. 6.2 - Prob. 47UYKCh. 6.2 - Prob. 48UYKCh. 6.2 - Prob. 49UYKCh. 6.2 - Prob. 50UYKCh. 6.2 - Prob. 51UYKCh. 6.2 - Prob. 52ECh. 6.2 - Prob. 53ECh. 6.2 - Prob. 54ECh. 6.2 - Prob. 55ECh. 6.2 - Prob. 56ECh. 6.2 - Prob. 57ECh. 6.2 - Prob. 58ECh. 6.2 - Prob. 59ECh. 6.2 - Prob. 60ECh. 6.2 - Prob. 61ECh. 6.2 - Prob. 62ECh. 6.2 - Prob. 63ECh. 6.2 - Prob. 64ECh. 6.2 - Prob. 65ECh. 6.2 - Prob. 66ECh. 6.2 - Prob. 67ECh. 6.2 - Prob. 68ECh. 6.2 - Prob. 69ECh. 6.2 - Prob. 70ECh. 6.2 - Prob. 71ECh. 6.2 - Prob. 72ECh. 6.2 - Prob. 73ECh. 6.2 - Prob. 74ECh. 6.2 - Prob. 75ECh. 6.2 - Prob. 76ECh. 6.2 - Prob. 77ECh. 6.2 - Prob. 78ECh. 6.2 - Prob. 79ECh. 6.2 - Prob. 80ECh. 6.2 - Prob. 81ECh. 6.2 - Prob. 82ECh. 6.2 - Prob. 83ECh. 6.2 - Prob. 84ECh. 6.2 - Prob. 85ECh. 6.2 - Prob. 86ECh. 6.2 - Prob. 87ECh. 6.2 - Prob. 88ECh. 6.2 - Prob. 89ECh. 6.3 - Prob. 90UYKCh. 6.3 - Prob. 91UYKCh. 6.3 - Prob. 92ECh. 6.3 - Prob. 93ECh. 6.3 - Prob. 94ECh. 6.3 - Prob. 95ECh. 6.3 - Prob. 96ECh. 6.3 - Prob. 97ECh. 6.3 - Prob. 98ECh. 6.3 - Prob. 99ECh. 6.3 - Prob. 100ECh. 6.3 - Prob. 101ECh. 6.3 - Prob. 102ECh. 6.3 - Prob. 103ECh. 6.3 - Prob. 104ECh. 6.3 - Prob. 105ECh. 6.3 - Prob. 106ECh. 6.3 - Prob. 107ECh. 6.3 - Prob. 108ECh. 6.3 - Prob. 109ECh. 6.4 - Prob. 110ECh. 6.4 - Prob. 111ECh. 6.4 - Prob. 112ECh. 6.4 - Prob. 113ECh. 6.4 - Prob. 114ECh. 6.4 - Prob. 115ECh. 6.4 - Prob. 116ECh. 6.4 - Prob. 117ECh. 6.4 - Prob. 118ECh. 6.4 - Prob. 119ECh. 6.4 - Prob. 120ECh. 6.4 - Prob. 121ECh. 6.4 - Prob. 122ECh. 6.4 - Prob. 123ECh. 6 - Prob. 124ECh. 6 - Prob. 125ECh. 6 - Prob. 126ECh. 6 - Prob. 127ECh. 6 - Prob. 128ECh. 6 - Prob. 129ECh. 6 - Prob. 130ECh. 6 - Prob. 131ECh. 6 - Prob. 132ECh. 6 - Prob. 133ECh. 6 - Prob. 134ECh. 6 - Prob. 135ECh. 6 - Prob. 136ECh. 6 - Prob. 137ECh. 6 - Prob. 138ECh. 6 - Prob. 139ECh. 6 - Prob. 140ECh. 6 - Prob. 141ECh. 6 - Prob. 142ECh. 6 - Prob. 143ECh. 6 - Prob. 144E
Knowledge Booster
Background pattern image
Statistics
Learn more about
Need a deep-dive on the concept behind this application? Look no further. Learn more about this topic, statistics and related others by exploring similar questions and additional content below.
Recommended textbooks for you
Text book image
MATLAB: An Introduction with Applications
Statistics
ISBN:9781119256830
Author:Amos Gilat
Publisher:John Wiley & Sons Inc
Text book image
Probability and Statistics for Engineering and th...
Statistics
ISBN:9781305251809
Author:Jay L. Devore
Publisher:Cengage Learning
Text book image
Statistics for The Behavioral Sciences (MindTap C...
Statistics
ISBN:9781305504912
Author:Frederick J Gravetter, Larry B. Wallnau
Publisher:Cengage Learning
Text book image
Elementary Statistics: Picturing the World (7th E...
Statistics
ISBN:9780134683416
Author:Ron Larson, Betsy Farber
Publisher:PEARSON
Text book image
The Basic Practice of Statistics
Statistics
ISBN:9781319042578
Author:David S. Moore, William I. Notz, Michael A. Fligner
Publisher:W. H. Freeman
Text book image
Introduction to the Practice of Statistics
Statistics
ISBN:9781319013387
Author:David S. Moore, George P. McCabe, Bruce A. Craig
Publisher:W. H. Freeman
F- Test or F- statistic (F- Test of Equality of Variance); Author: Prof. Arvind Kumar Sing;https://www.youtube.com/watch?v=PdUt7InTyc8;License: Standard Youtube License
Statistics 101: F-ratio Test for Two Equal Variances; Author: Brandon Foltz;https://www.youtube.com/watch?v=UWQO4gX7-lE;License: Standard YouTube License, CC-BY
Hypothesis Testing and Confidence Intervals (FRM Part 1 – Book 2 – Chapter 5); Author: Analystprep;https://www.youtube.com/watch?v=vth3yZIUlGQ;License: Standard YouTube License, CC-BY
Understanding the Levene's Test for Equality of Variances in SPSS; Author: Dr. Todd Grande;https://www.youtube.com/watch?v=udJr8V2P8Xo;License: Standard Youtube License