
Videos
(a)
To graph: A diagram with the use of confidence interval applet.
(a)
Explanation of Solution
Calculation: To construct confidence inetrvals, use confidence interval applet. The following steps are provided below:
Step 1: Go to the “Confidence interval applets” in the website. The screenshot is
shown below:

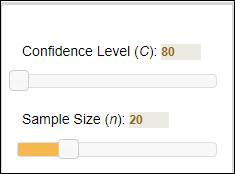
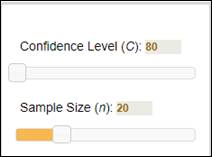
Step 2: Specify confidence interval as “80” and specify the sample size as “20.” The screenshot is shown below:
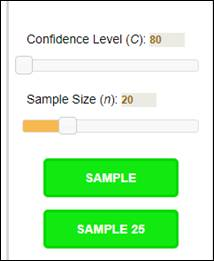
Step 3: Click on the “Sample 25” to generate the sample. The screenshot is shown below:

Graph: The obtained output is shown below:

From the above srceenshot, intervals that contain the true mean
Interpretation: From the above output, out of a total 25, 21 intervals contain the true mean and the proportion of the interval that contains true mean is 84%.
(b)
To find: The confidence interval with 50 SRSs.
(b)
Answer to Problem 5UYK
Solution: The confidence interval with 50 SRSs is shown below:
Explanation of Solution
Calculation: To construct confidence intervals, use confidence interval applet. The following steps are provided below:
Step 1: Go to the “Confidence interval applets” in the website. The screenshot is shown below:
Step 2: Specify confidence interval as “80” and specify the sample size as “20.” The screenshot is shown below:
Step 3: Click twice on the “Sample 25” to generate the sample. The screenshot is shown below:
The obtained output is shown below:

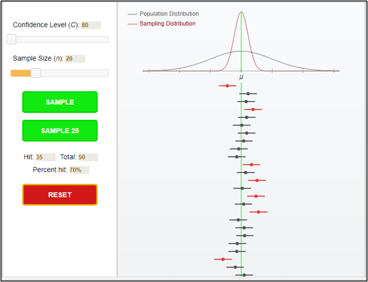
From the above sceenshort, intervals that contain the true mean
Interpretation: The above figure indicates the hit 35, total 50, and percent hit 70%. Thirty-five out of 50 intervals contain the true mean and the proportion of the interval that contains the true mean is 70%.
To find: The confidence interval with 100 SRSs.
Answer to Problem 5UYK
Solution: The confidence interval with 100 SRSs is shown below:
Explanation of Solution
Calculation: To construct confidence inetrvals, use confidence interval applet. The following steps are provided below:
Step 1: Go to the “Confidence interval applets” in the website. The screenshot is shown below:

Step 2: Specify confidence interval as “80” and specify the sample size as “20.” The screenshot is shown below:
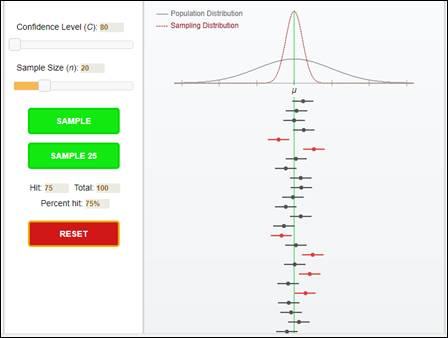
Step 3: Click four times on the “Sample 25” to generate the sample. The screenshot is shown below:
The obtained output is shown below:
From the above sceenshort, intervals that contain the true mean
Interpretation: The above figure indicates the hit 75, total 100, and percent hit 75%. Seventy-five out of 100 intervals contain the true mean and the proportion of the interval that contains the true mean is 75%.
To find: The confidence interval with 200 SRSs.
Answer to Problem 5UYK
Solution: The confidence interval with 200 SRSs is shown below:
Explanation of Solution
Calculation: To construct confidence inetrvals, use confidence interval applet. The following steps are provided below:
Step 1: Go to the “Confidence interval applets” in the website. The screenshot is shown below:
Step 2: Specify confidence interval as “80” and specify the sample size as “20.” The screenshot is shown below:
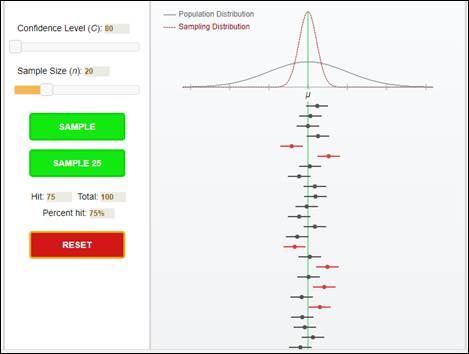
Step 3: Click eight times on the “Sample 25” to generate the sample. The screenshot is shown below:
The obtained output is shown below:
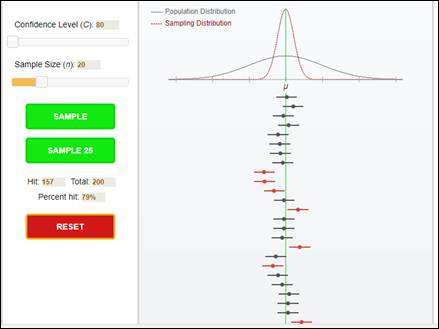
From the above sceenshort, intervals that contain the true mean
Interpretation: The above figure indicates the hit 157, total 200, and percent hit 79%. One hundred and fifty-seven out of 200 intervals contain the true mean and the proportion of the interval that contains the true mean is 79%.
To find: The confidence interval with 300 SRSs.
Answer to Problem 5UYK
Solution: The confidence interval with 300 SRSs is shown below:

Explanation of Solution
Calculation: To construct confidence inetrvals, use confidence interval applet. The following steps are provided below:
Step 1: Go to the “Confidence interval applets” in the website. The screenshot is shown below:
Step 2: Specify confidence interval as “80” and specify the sample size as “20.” The screenshot is shown below:
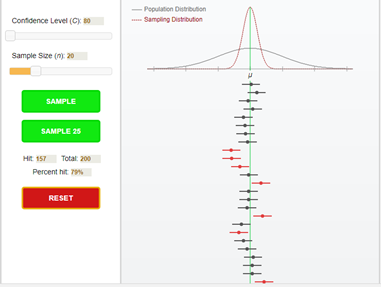
Step 3: Click 12 times on the “Sample 25” to generate the sample. The screenshot is shown below:
The obtained output is shown below:

From the above sceenshort, intervals that contain the true mean
Interpretation: The above figure indicates the hit 232, total 300, and percent hit 77%. Two hundred and thirty-two out of 300 intervals contain the true mean and the proportion of the interval that contains the true mean is 77%.
To find: The confidence interval with 400 SRSs.
Answer to Problem 5UYK
Solution: The confidence interval with 400 SRSs is shown below:

Explanation of Solution
Calculation: To construct confidence inetrvals, use confidence interval applet. The following steps are provided below:
Step 1: Go to the “Confidence interval applets” in the website. The screenshot is shown below:
Step 2: Specify confidence interval as “80” and specify the sample size as “20.” The screenshot is shown below:
Step 3: Click 16 times on the “Sample 25” to generate the sample. The screenshot is shown below:
The obtained output is shown below:

From the above sceenshort, intervals that contain the true mean
Interpretation: The above figure indicates the hit 315, total 400, and percent hit 79%. Three hundred and fifteen out of 400 intervals contain the true mean and the proportion of the interval that contains the true mean is 79%.
To find: The confidence interval with 500 SRSs.
Answer to Problem 5UYK
Solution: The confidence interval with 500 SRSs is shown below:

Explanation of Solution
Calculation: To construct confidence inetrvals, use confidence interval applet. The following steps are provided below:
Step 1: Go to the “Confidence interval applets” in the website. The screenshot is shown below:
Step 2: Specify confidence interval as “80” and specify the sample size as “20.” The screenshot is shown below:
Step 3: Click 20 on the “Sample 25” to generate the sample. The screenshot is shown below:
The obtained output is shown below:

From the above sceenshort, intervals that contain the true mean
Interpretation: The above figure indicates the hit 397, total 500, and percent hit 79%. Three hundred and ninety-seven out of 500 intervals contain the true mean and the proportion of the interval that contains the true mean is 79%. From the pattern in the above seven cases, the proportion hit approaches near by 80% as the number of sample increases. Thus, one should expect that the percent capture to get closer to the confidence interval level is 80% as the number of samples increases.
Want to see more full solutions like this?
Chapter 6 Solutions
Introduction to the Practice of Statistics


 MATLAB: An Introduction with ApplicationsStatisticsISBN:9781119256830Author:Amos GilatPublisher:John Wiley & Sons Inc
 Probability and Statistics for Engineering and th...StatisticsISBN:9781305251809Author:Jay L. DevorePublisher:Cengage Learning
 Statistics for The Behavioral Sciences (MindTap C...StatisticsISBN:9781305504912Author:Frederick J Gravetter, Larry B. WallnauPublisher:Cengage Learning
 Elementary Statistics: Picturing the World (7th E...StatisticsISBN:9780134683416Author:Ron Larson, Betsy FarberPublisher:PEARSON
 The Basic Practice of StatisticsStatisticsISBN:9781319042578Author:David S. Moore, William I. Notz, Michael A. FlignerPublisher:W. H. Freeman
 Introduction to the Practice of StatisticsStatisticsISBN:9781319013387Author:David S. Moore, George P. McCabe, Bruce A. CraigPublisher:W. H. Freeman