
Concept explainers
Videos
The following MINITAB output presents the results of a hypothesis test for a population proportion p.
| Test and CI for One Proportion : X | ||||||
| Test of p = 0.4 vs p < 0.4 | ||||||
| Variable X | X 73 | N 240 | Sample p 0.304167 | 95% Upper Bound 0.353013 | Z-Value –3.03 | P-Value 0.001 |
- a. Is this a one-tailed or two-tailed test?
- b. What is the null hypothesis?
- c. Can H0 be rejected at the 2% level? How can you tell?
- d. Someone asks you whether the null hypothesis H0 : p ≥ 0.45 versus H1 : p > 0.45 can be rejected at the 2% level. Can you answer without doing any calculations? How?
- e. Use the output and an appropriate table to compute the P-value for the test of H0 : p ≤ 0.25 versus H1: p > 0.25.
- f. Use the output and an appropriate table to compute a 90% confidence interval for p.
a.
Identify whether the hypotheses test is a one tailed or two tailed test.
Answer to Problem 12E
The test is a one tailed test.
Explanation of Solution
Given info:
The MINITAB output represents the results of a hypothesis test for a population proportion.
Justification:
From the given MINITAB output, the alternative hypothesis represents the less than symbol. Therefore, the form of alternative hypothesis is
b.
Find the null hypothesis.
Explanation of Solution
Justification:
From the MINITAB output, the form of alternative hypothesis is
Thus, the null hypothesis is
c.
Check whether the null hypothesis is rejected at the 2% level or not.
Answer to Problem 12E
Yes, the null hypothesis can be rejected at the 2% level.
Explanation of Solution
Calculation:
From the given MINITAB output, the test statistic is –3.03 and the P-value is 0.001.
Decision rule:
If
If
Conclusion:
Here, the P-value is less than the level of significance 0.02.
That is
Therefore, the null hypothesis is rejected.
d.
Check whether the null hypothesis
Answer to Problem 12E
Yes, the null hypothesis can be rejected at the 2% level.
Explanation of Solution
Calculation:
From the given MINITAB output, the sample proportion is 0.304167.
Thus, the P-value for
e.
Find the P-value for the test of
Answer to Problem 12E
The P-value is 0.026.
Explanation of Solution
Calculation:
Test statistic and P-value:
Software Procedure:
Step-by-step procedure to obtain the z-score using the MINITAB software:
- Choose Stat > Basic Statistics > 1 Proportion.
- Choose Summarized data.
- In Number of events, enter 73. In Number of trials, enter 240.
- Check Perform hypothesis test. In Hypothesized proportion, enter 0.25.
- Click Options. Under Alternative, and choose less than.
- Click OK in each dialog box.
Output using the MINITAB software is given below:
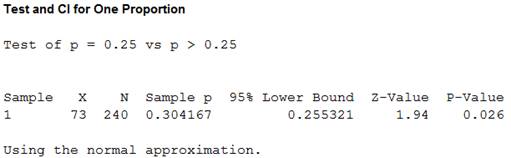
From the MINITAB output, the z-score is 1.94 and the P-value is 0.026.
f.
Find the 90% confidence interval for p.
Answer to Problem 12E
The 90% confidence interval is (0.2588, 0.3560).
Explanation of Solution
Calculation:
The formula for confidence interval is as follows:
Where,
The value of
Critical value:
Software procedure:
Step-by-step procedure to obtain the critical value using the MINITAB software:
- Choose Graph > Probability Distribution Plot choose View Probability > OK.
- From Distribution, choose ‘Normal’ distribution.
- Click the Shaded Area tab.
- Choose Probability Value and Both Tail for the region of the curve to shade.
- Enter the Probability value as 0.10.
- Click OK.
Output using the MINITAB software is given below:
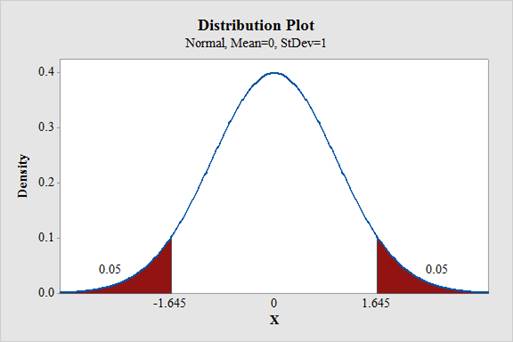
Thus,
The 90% confidence interval is as follows:
Thus, the 90% confidence interval is (0.2588, 0.3560).
Want to see more full solutions like this?
Chapter 6 Solutions
Statistics for Engineers and Scientists (Looseleaf)
Additional Math Textbook Solutions
Business Statistics: A First Course (7th Edition)
Elementary Statistics: Picturing the World (6th Edition)
Developmental Mathematics (9th Edition)
Introductory Statistics (2nd Edition)
Basic Business Statistics, Student Value Edition (13th Edition)


- Which of the following best describes the null hypothesis associated with using a 2-sample t-test to compare an outcome between 2 groups? Question 1 options: The population median in group 1 = the population median in group 2 The sample mean in group 1 = the sample mean in group 2 There is no difference between group 1 and group 2 The population mean in group 1 = the population mean in group 2 Group 1 = group 2arrow_forwardWith H1: p < 0.32, a test statistic is z = -1.23. Use a 0.01 significance level to find the P-value, and state the conclusion about the null hypothesis.arrow_forwardAlso, using α = .05, run a two-tail t-test for one sample to test Ho: µ=283 for the 2009 scores. Report the t-obt, df, and p-values. Would you reject the null hypothesis that the 2009 scores come from a population with average 283? If this is the case, does it come from a population from larger or smaller average?arrow_forward
 MATLAB: An Introduction with ApplicationsStatisticsISBN:9781119256830Author:Amos GilatPublisher:John Wiley & Sons Inc
 Probability and Statistics for Engineering and th...StatisticsISBN:9781305251809Author:Jay L. DevorePublisher:Cengage Learning
 Statistics for The Behavioral Sciences (MindTap C...StatisticsISBN:9781305504912Author:Frederick J Gravetter, Larry B. WallnauPublisher:Cengage Learning
 Elementary Statistics: Picturing the World (7th E...StatisticsISBN:9780134683416Author:Ron Larson, Betsy FarberPublisher:PEARSON
 The Basic Practice of StatisticsStatisticsISBN:9781319042578Author:David S. Moore, William I. Notz, Michael A. FlignerPublisher:W. H. Freeman
 Introduction to the Practice of StatisticsStatisticsISBN:9781319013387Author:David S. Moore, George P. McCabe, Bruce A. CraigPublisher:W. H. Freeman