
Videos
A statistics instructor who teaches a lecture section of 160 students wants to determine whether students have more difficulty with one-tailed hypothesis tests or with two-tailed hypothesis tests. On the next exam, 80 of the students, chosen at random, get a version of the exam with a 10-point question that requires a one-tailed test. The other 80 students get a question that is identical except that it requires a two-tailed test. The one-tailed students average 7.79 points, and their standard deviation is 1.06 points. The two-tailed students average 7.64 points, and their standard deviation is 1.31 points.
a. Can you conclude that the
b. Can you conclude that the mean score μ1 on one-tailed hypothesis test questions differs from the mean score μ2 on two-tailed hypothesis test questions? State the appropriate null and alternate hypotheses, and then compute the P-value.
a.
Check whether there is evidence to conclude that the mean score
Answer to Problem 7E
There is no evidence to conclude that the mean score
Explanation of Solution
Given info:
For one tailed hypothesis tests, the number of students is
For two tailed hypothesis tests, the number of students is
Calculation:
Consider
State the test hypotheses.
Null hypotheses:
That is, the mean score
Alternative hypothesis:
That is, the mean score
The formula for z-score is,
The z-score is calculated as follows,
Thus, the z-score is 0.80.
P-value:
Software Procedure:
Step-by-step procedure to obtain the P- value using the MINITAB software:
- Choose Graph > Probability Distribution Plot choose View Probability > OK.
- From Distribution, choose ‘Normal’ distribution.
- Click the Shaded Area tab.
- Choose X Value and Right Tail for the region of the curve to shade.
- Enter the data value as 0.80.
- Click OK.
Output using the MINITAB software is given below:
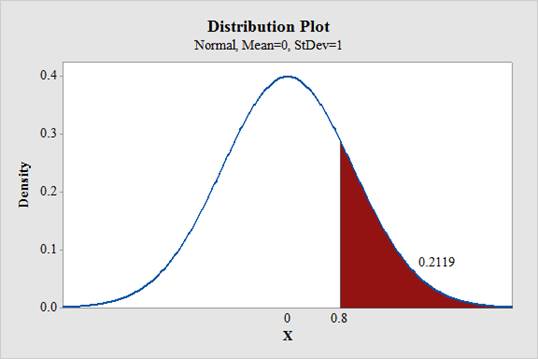
From the MINITAB output, the P-value for right tail test is 0.2119.
Decision rule:
If
If
Conclusion:
Here, the P-value is 0.2119, which is not small.
That is, the P-value is larger than any level of significance.
Therefore, the null hypothesis is not rejected.
Hence, there is no evidence to conclude that the mean score
b.
Check whether there is evidence to conclude that the mean score
Answer to Problem 7E
There is no evidence to conclude that the mean score
Explanation of Solution
Calculation:
State the test hypotheses.
Null hypotheses:
That is, the mean score
Alternative hypothesis:
That is, the mean score
From part a., the z-score is 0.80.
P-value:
Software Procedure:
Step-by-step procedure to obtain the P- value using the MINITAB software:
- Choose Graph > Probability Distribution Plot choose View Probability > OK.
- From Distribution, choose ‘Normal’ distribution.
- Click the Shaded Area tab.
- Choose X Value and Both Tails for the region of the curve to shade.
- Enter the data value as 0.80.
- Click OK.
Output using the MINITAB software is given below:
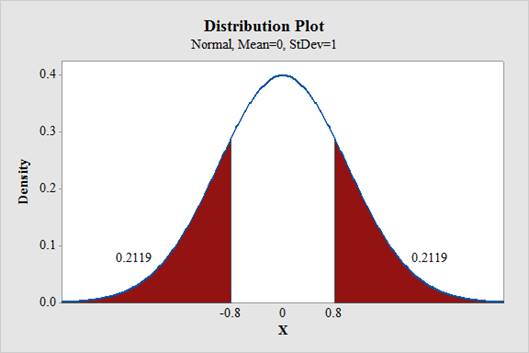
From the MINITAB output, the P-value for two tail test is,
Conclusion:
Here, the P-value is 0.4238, which is not small.
That is, the P-value is larger than any level of significance.
Therefore, the null hypothesis is not rejected.
Hence, there is no evidence to conclude that the mean score
Want to see more full solutions like this?
Chapter 6 Solutions
Statistics for Engineers and Scientists (Looseleaf)
Additional Math Textbook Solutions
Business Statistics: A First Course (8th Edition)
Elementary Statistics (13th Edition)
Probability and Statistics for Engineering and the Sciences
Applied Statistics in Business and Economics
An Introduction to Mathematical Statistics and Its Applications (6th Edition)


 College AlgebraAlgebraISBN:9781305115545Author:James Stewart, Lothar Redlin, Saleem WatsonPublisher:Cengage Learning
 College Algebra (MindTap Course List)AlgebraISBN:9781305652231Author:R. David Gustafson, Jeff HughesPublisher:Cengage Learning