
Videos
The paper “Accuracy and Reliability of Self-Reported Weight and Height in the Sister Study” {Public Health Nutrition [2012]: 989-999) investigates whether women accurately report their weight. The table below is based on comparing actual weight to self-reported weight for women participating in a large-scale medical study. Each participant was classified into a category describing accuracy of reported weight and also by age.
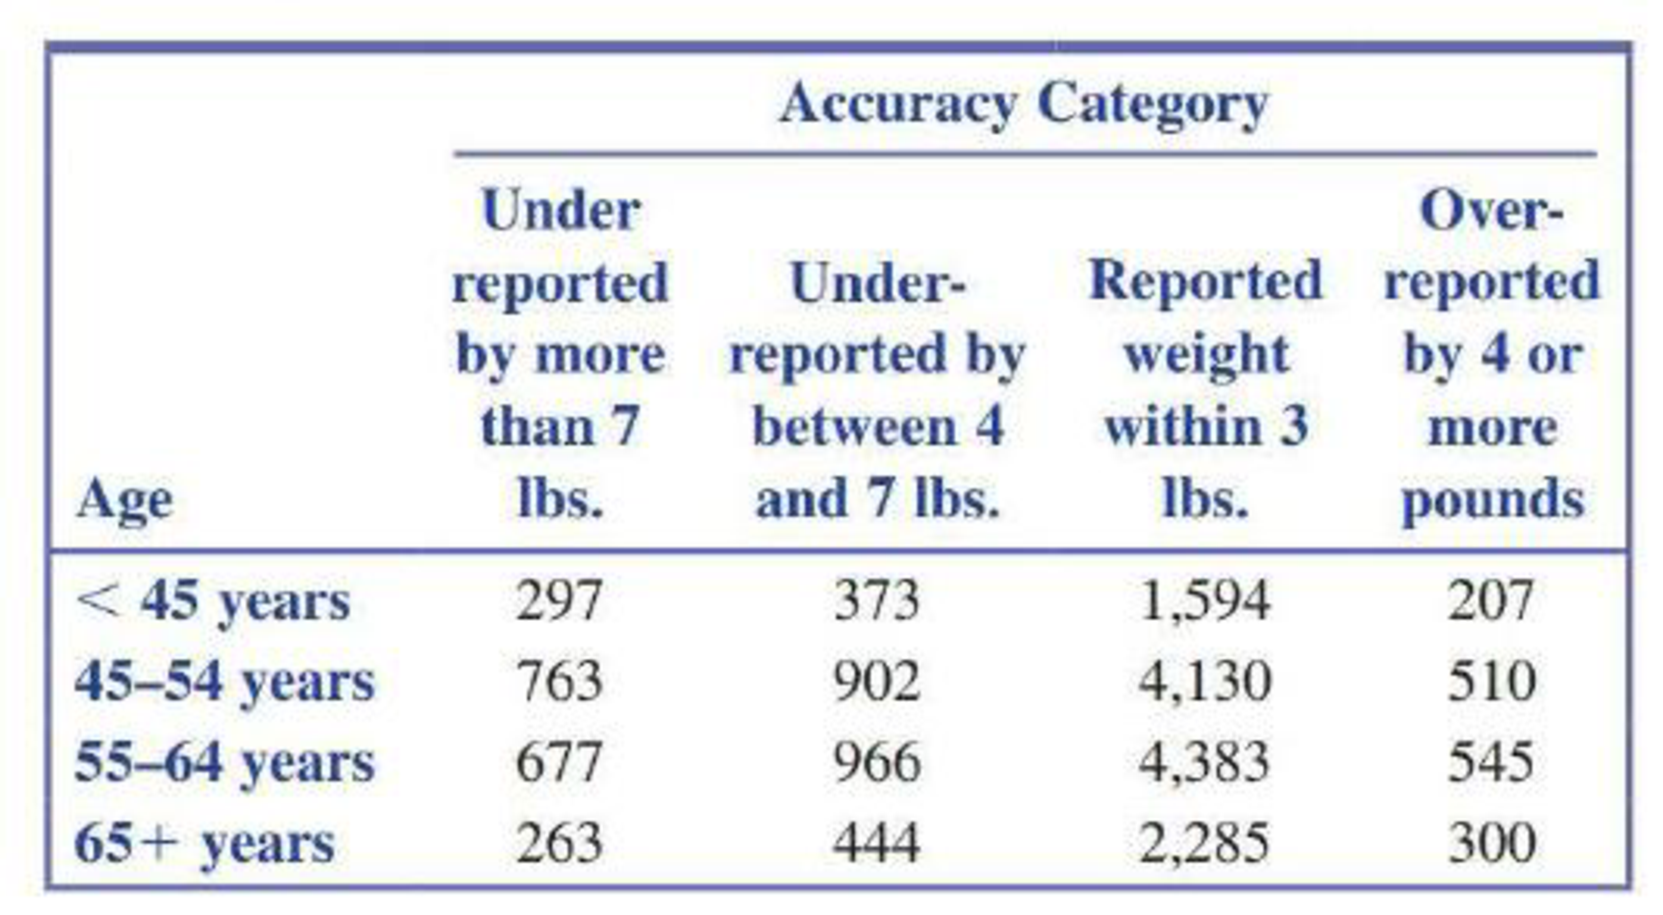
Assume that it is reasonable to consider these data representative of adult women in the United States. Consider the following conclusion:
Most women reported their weight to within 3 pounds of their actual weight. Older women were less likely to under report their weight and more likely to over report their weight than younger women.
Provide a justification for this conclusion. Use the information in the table to calculate relevant probabilities.
Want to see the full answer?
Check out a sample textbook solution
Chapter 6 Solutions
INTRODUCTION TO STATISTICS & DATA ANALYS


- High levels of blood sugar are associated with an increased risk of type 2 diabetes. A levelhigher than normal is referred to as “impaired fasting glucose.” The article “Association ofLow-Moderate Arsenic Exposure and Arsenic Metabolism with Incident Diabetes andInsulin Resistance in the Strong Heart Family Study” (M. Grau-Perez, C. Kuo, et al.,Environmental Health Perspectives, 2017, online) reports a study in which 47 of 155 peoplewith impaired fasting glucose had type 2 diabetes. Consider this to be a simple randomsample. a) Find a 95% confidence interval for the proportion of people with impaired fasting glucose who have type 2 diabetes. b) Find a 99% confidence interval for the proportion of people with impaired fasting glucose who have type 2 diabetes. c) A doctor claims that less than 35% of people with impaired fasting glucose have type 2 diabetes. With what level of confidence can this claim be made?arrow_forwardA scientist selected a random sample of seven varieties of peach ice cream to investigate the relationship between the density, in pounds per cubic inch, of the varieties of ice cream and the percent concentration of peaches in the ice cream. Assuming all conditions for inference are met, which of the following significance tests should be used to investigate whether there is convincing evidence at the 0.05 level of significance that a greater percent of peaches in the ice cream is associated with an increase in the density of the ice cream? A. A two-sample t-test for a difference between means B. A chi-square test of independence C. A linear regression t-test for slope D. A two-sample z-test for a difference between proportions E. A matched pairs t-test for a mean differencearrow_forwardA Canadian study measuring depression level in teens (as reported in the Journal of Adolescence, vol. 25, 2002) randomly sampled 112 male teens and 101 female teens, and scored them on a common depression scale (higher score representing more depression). The researchers suspected that the mean depression score for male teens is higher than for female teens, and wanted to check whether data would support this hypothesis. What conclusion can you draw from the output? The data provide sufficient evidence to reject H0 and to conclude that the mean depression score for male teens is larger than that of female teens. The data provide sufficient evidence to conclude that male and female teens do not differ in mean depression score. The data do not provide sufficient evidence to conclude that the mean depression score of male teens is larger than that of female teens. The data do not provide sufficient evidence to reject H0, so we accept it, and conclude that male and female teens do…arrow_forward
- Is Seat Belt Use Independent of Cigarette Smoking?A study of seat belt users and nonusers yielded the randomly selected sample data summarized in the given table (based on data from “What Kinds of People Do Not Use Seat Belts?” by Helsing and Comstock,American Journal of Public Health,Vol. 67, No. 11). Test the claim that the amount of smoking is independent of seat belt use. A plausible theory is that people who smoke more are less concerned about their health and safety and are therefore less inclined to wear seat belts. Is this theory supported by the sample data?arrow_forwardIn a study of smokers who tried to quit smoking with nicotine patch therapy, 39 were smoking one year after the treatment, and 32 were not smoking one year after the treatment (based on data from “High Dose Nicotine Patch Therapy,” by Dale et al., Journal of the American Medical Association, Vol. 274, No. 17). We want to use a 0.05 significance level to test the claim that among smokers who try to quit with nicotine patch therapy, the majority are smoking a year after the treatment. Describe a type 1 error for this test.arrow_forwardIn a study of smokers who tried to quit smoking with nicotine patch therapy, 39 were smoking one year after the treatment, and 32 were not smoking one year after the treatment (based on data from “High Dose Nicotine Patch Therapy,” by Dale et al., Journal of the American Medical Association, Vol. 274, No. 17). We want to use a 0.05 significance level to test the claim that among smokers who try to quit with nicotine patch therapy, the majority are smoking a year after the treatment. What do you conclude? (Be sure to address the original claim that among smokers who try to quit with nicotine patch therapy, the majority are smoking a year after the treatment.arrow_forward
- In a study of smokers who tried to quit smoking with nicotine patch therapy, 39 were smoking one year after the treatment, and 32 were not smoking one year after the treatment (based on data from “High Dose Nicotine Patch Therapy,” by Dale et al., Journal of the American Medical Association, Vol. 274, No. 17). We want to use a 0.05 significance level to test the claim that among smokers who try to quit with nicotine patch therapy, the majority are smoking a year after the treatment. What do you conclude? (Be sure to address the original claim that the mean weight is 5.670 grams).arrow_forwardIn a study of smokers who tried to quit smoking with nicotine patch therapy, 39 were smoking one year after the treatment, and 32 were not smoking one year after the treatment (based on data from “High Dose Nicotine Patch Therapy,” by Dale et al., Journal of the American Medical Association, Vol. 274, No. 17). We want to use a 0.05 significance level to test the claim that among smokers who try to quit with nicotine patch therapy, the majority are smoking a year after the treatment.arrow_forwardFive samples of a ferrous-type substance were used to determine if there is a difference between a laboratory chemical analysis and an X-ray fluorescence analysis of the iron content. Each sample was split into two subsamples and the two types of analysis were applied, with the accompanying results. Assuming that the populations are normal, test at the 0.10 level of significance whether the two methods of analysis give, on the average, the same result.arrow_forward
- A new drug for pain relief is being tested within a given palliative care population. The new drug is being compared to an already approved pain relief drug that is commonly used in providing palliative care to patients who experience chronic severe pain. Assume the patients are asked to rate the pain on a scale from 1 to 10, and the data presented below was obtained from a small study designed to compare the effectiveness of the two drugs. Set up and interpret the results of a Mann-Whitney U test with an alpha of .05. Pain Rating as Reported by Patients Old Drug 1 2 2 4 6 New Drug 1 2 2 3 7 Old Drug New Drug Total Sample (Ordered Smallest to Largest) Ranks Old Drug New Drug Old Drug New Drug 1 1 1 1 1.5 1.5 2 2 2 2 4.5 4.5 2 2 2 2 4.5 4.5 4 3 3 7 6 7 4 8 6…arrow_forwardA new drug for pain relief is being tested within a given palliative care population. The new drug is being compared to an already approved pain relief drug that is commonly used in providing palliative care to patients who experience chronic severe pain. Assume the patients are asked to rate the pain on a scale from 1 to 10, and the data presented below was obtained from a small study designed to compare the effectiveness of the two drugs. Set up and interpret the results of a Mann-Whitney U test with an alpha of .05. Pain Rating as Reported by Patients Old Drug 1 3 3 4 6 New Drug 1 2 3 3 7arrow_forwardA new drug for pain relief is being tested within a given palliative care population. The new drug is being compared to an already approved pain relief drug that is commonly used in providing palliative care to patients who experience chronic severe pain. Assume the patients are asked to rate the pain on a scale from 1 to 10, and the data presented below was obtained from a small study designed to compare the effectiveness of the two drugs. Set up and interpret the results of a Mann-Whitney U test with an alpha of .05. Pain Rating as Reported by PatientsOld Drug 1 2 2 4 6 New Drug 1 2 2 3 7Old Drug New Drug Total Sample(Ordered Smallest to Largest) RanksOld Drug New Drug Old Drug New DrugR1= R2= A) We reject H0 in favor of H1, which states the two populations are not equal at the alpha equals .05 level because the calculated U value of 12.5 is greater than the critical U value of 2.B) We reject H0 in favor of H1, which states the two populations are not equal at the alpha equals .05…arrow_forward
 MATLAB: An Introduction with ApplicationsStatisticsISBN:9781119256830Author:Amos GilatPublisher:John Wiley & Sons Inc
 Probability and Statistics for Engineering and th...StatisticsISBN:9781305251809Author:Jay L. DevorePublisher:Cengage Learning
 Statistics for The Behavioral Sciences (MindTap C...StatisticsISBN:9781305504912Author:Frederick J Gravetter, Larry B. WallnauPublisher:Cengage Learning
 Elementary Statistics: Picturing the World (7th E...StatisticsISBN:9780134683416Author:Ron Larson, Betsy FarberPublisher:PEARSON
 The Basic Practice of StatisticsStatisticsISBN:9781319042578Author:David S. Moore, William I. Notz, Michael A. FlignerPublisher:W. H. Freeman
 Introduction to the Practice of StatisticsStatisticsISBN:9781319013387Author:David S. Moore, George P. McCabe, Bruce A. CraigPublisher:W. H. Freeman