
Videos
A study of how people are using online services for medical consulting is described in the paper “Internet Based Consultation to Transfer Knowledge for Patients Requiring Specialized Care” (British Medical Journal [2003]: 696-699). Patients using a particular online site could request any combination of three services: specialist opinion, assessment of imaging studies (such as X-ray and MRI), and assessment of pathology results.
The accompanying table shows the combinations of services that were requested by 79 patients in their online consultations.
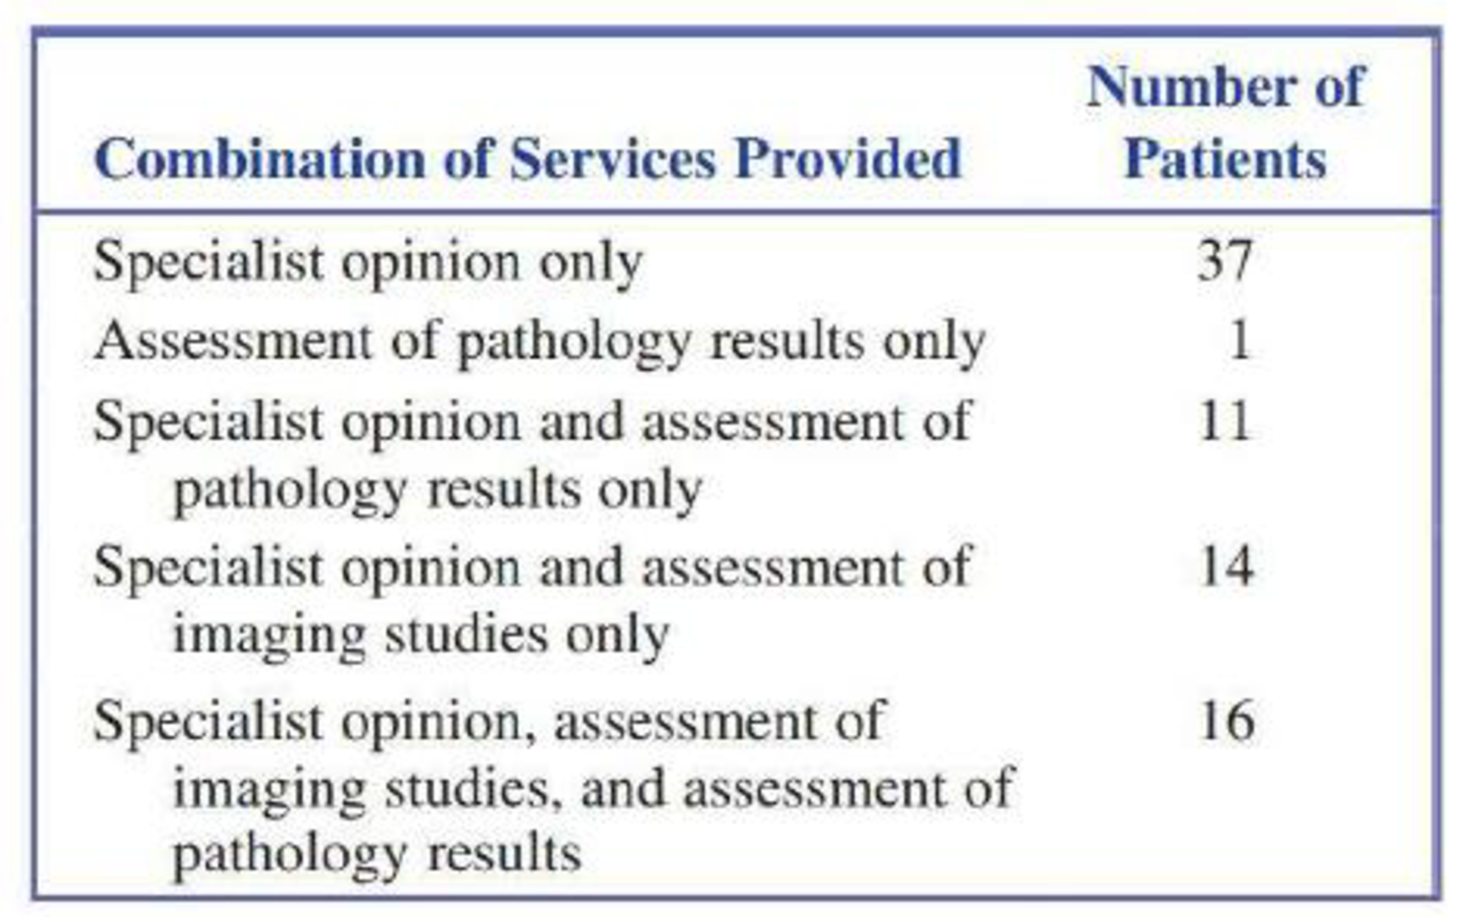
For a randomly selected patient from this study, define the events O, I, and A as follows:
O =
I = event that the online consultation involves the assessment of imaging studies
A = event that the online consultation involves the assessment of pathology results
Use the given information to calculate the following probabilities:
- a. P(O)
- b. P(not A)
- c. P(O ∩ I)
- d. P(I|O)
- e. P(O|I)

Trending nowThis is a popular solution!

Chapter 6 Solutions
INTRODUCTION TO STATISTICS & DATA ANALYS


- Based on a survey of 12,344 U.S. college students and 6,729 Canadian college students, Kuo, Adlaf, Lee, Gliksman, Demers, and Wechsler (2002) report that alcohol use is more common among Canadian than U.S. students, but heavy drinking (five or more drinks in a row for males, four or more for females) is significantly higher among U.S. students than Canadian students. Is this an example of a survey research design?arrow_forwardA research article on the effect of multitasking on grade performance describes an experiment in which 62 undergraduate business students were randomly assigned to one of two experimental groups. Students in one group were asked to listen to a lecture but were told that they were permitted to use cell phones to send text messages during the lecture. Students in the second group listened to the same lecture but were not permitted to send text messages. Afterwards, students in both groups took a quiz on material covered in the lecture. Data from this experiment are summarized in the accompanying table.arrow_forwardAn automotive engineer is investigating two different types of metering devices for an electronic fuel injection system to determine whether they differ in their fuel mileage performance. The system is installed on 10 different cars, and a test is run with each metering device on each car. The data is provided below: Metering Device Car 1 2 1 17.6 16.8 2 19.4 20.0 3 18.2 17.6 4 17.1 16.4 5 15.3 16.0 6 15.9 15.9 7 16.3 16.5 8 18.0 18.4 9 17.3 16.4 10 19.1 20.1 Is there a significant difference between the means of the two metering devices? Use . Interpret the result in the context of the problem. An article in the journal Hazardous Waste and Hazardous Materials (Vol. 6, 1989) reported the results of an analysis of the weight of calcium in standard cement and cement doped with lead. Reduced levels of calcium would indicate that the hydration mechanism in the cement is blocked…arrow_forward
- A study was performed on 200 elementary school students to investigate whether regular Vitamin A supplementation was effective in preventing colds during the month of March. 100 were randomized to receive daily Vitamin A supplements during the month of March, and 100 students were randomized to a placebo group (and did not receive Vitamin A) during the same month. The number of students getting at least one cold in March was computed in the two groups, and the results are given in the following 2 X 2 table. Using a 5% level of significance determine whether there is an association between Vitamin A supplementation and prevention of Common Cold ColdNo Cold Vitamin A1585100 Placebo2575100 40160200arrow_forwardA paper investigated the driving behavior of teenagers by observing their vehicles as they left a high school parking lot and then again at a site approximately 1 2 mile from the school. Assume that it is reasonable to regard the teen drivers in this study as representative of the population of teen drivers. MaleDriver FemaleDriver 1.3 -0.3 1.3 0.6 0.9 1.1 2.1 0.7 0.7 1.1 1.3 1.2 3 0.1 1.3 0.9 0.6 0.5 2.1 0.5 (a) Use a .01 level of significance for any hypothesis tests. Data consistent with summary quantities appearing in the paper are given in the table. The measurements represent the difference between the observed vehicle speed and the posted speed limit (in miles per hour) for a sample of male teenage drivers and a sample of female teenage drivers. (Use ?males − ?females. Round your test statistic to two decimal places. Round your degrees of freedom down to the nearest whole number. Round your p-value to three decimal places.) t = df =…arrow_forwardA paper investigated the driving behavior of teenagers by observing their vehicles as they left a high school parking lot and then again at a site approximately 1 2 mile from the school. Assume that it is reasonable to regard the teen drivers in this study as representative of the population of teen drivers. MaleDriver FemaleDriver 1.4 -0.2 1.2 0.5 0.9 1.1 2.1 0.7 0.7 1.1 1.3 1.2 3 0.1 1.3 0.9 0.6 0.5 2.1 0.5 (a) Use a .01 level of significance for any hypothesis tests. Data consistent with summary quantities appearing in the paper are given in the table. The measurements represent the difference between the observed vehicle speed and the posted speed limit (in miles per hour) for a sample of male teenage drivers and a sample of female teenage drivers. (Use ?males − ?females. Round your test statistic to two decimal places. Round your degrees of freedom down to the nearest whole number. Round your p-value to three decimal places.) t = df =…arrow_forward
- The article “Effects of Diets with Whole Plant-Origin Proteins Added with Different Ratiosof Taurine:Methionine on the Growth, Macrophage Activity and Antioxidant Capacity ofRainbow Trout (Oncorhynchus mykiss) Fingerlings” (O. Hernandez, L. Hernandez, et al.,Veterinary and Animal Science, 2017:4-9) reports that a sample of 210 juvenile rainbowtrout fed a diet fortified with equal amounts of the amino acids taurine and methionine for aperiod of 70 days had a mean weight gain of 313 percent with a standard deviation of 25, while 210 fish fed with a control diet had a mean weight gain of 233 percent with a standard deviation of 19. Units are percent. Find a 99% confidence interval for the difference in weight gain on the two diets.arrow_forwarda study in Sweden looked at former elite soccer players, people who had played soccer, but not at the elite level, and people of the same age who did not play soccer. Here is a two-way table that classifies these subjects by whether or not they had arthritis of the hip or knee by their mid-fifties: Elite Played, but not Elite Did not Play Total Arthritis 10 9 24 43 No Arthritis 61 206 548 815 Total 71 215 572 858 Complete the table for the totals. What percent of the men in this study did not play soccer? Among these subjects who did not play soccer, what percent has arthritis of the hip or knee? What percent of the men in this study has arthritis of the hip or knee? What percent of the men in this study was former elite soccer players?arrow_forwardA researcher conducted a medical study to investigate whether taking a low-dose aspirin reduces the chance of developing colon cancer. As part of the study, 1,000 adult volunteers were randomly assigned to one of two groups. Half of the volunteers were assigned to the experimental group that took a low-dose aspirin each day, and the other half were assigned to the control group that took a placebo each day. At the end of six years, 15 of the people who took the low-dose aspirin had developed colon cancer and 26 of the people who took the placebo had developed colon cancer. At the significance level α = 0.05, do the data provide convincing statistical evidence that taking a low-dose aspirin each day would reduce the chance of developing colon cancer among all people similar to the volunteers?arrow_forward
- Exercises 5–8 refer to the study of an association between which ear is used for cell phone calls and whether the subject is left-handed or right-handed. The study is reported in “Hemispheric Dominance and Cell Phone Use,” by Seidman et al., JAMA Otolaryngology—Head & Neck Surgery, Vol. 139, No. 5. The study began with a survey e-mailed to 5000 people belonging to an otology online group, and 717 surveys were returned. (Otology relates to the ear and hearing.) Sampling Method What type of sampling best describes the way in which the 717 subjects were chosen: simple random sample, systematic sample, convenience sample, stratified sample, cluster sample? Does the method of sampling appear to adversely affect the quality of the results?arrow_forwardExercises 5–8 refer to the study of an association between which ear is used for cell phone calls and whether the subject is left-handed or right-handed. The study is reported in “Hemispheric Dominance and Cell Phone Use,” by Seidman et al., JAMA Otolaryngology—Head & Neck Surgery, Vol. 139, No. 5. The study began with a survey e-mailed to 5000 people belonging to an otology online group, and 717 surveys were returned. (Otology relates to the ear and hearing.)arrow_forwardThe article ``Work-Related Attitudes" (Psychological Reports, 1991:443-450) reports the results of a survey of 395 elementary school teachers and 266 high school teachers. Of the elementary school teachers, 224 said they were very satisfied with their jobs, whereas 126 of the high school high school teachers were very satisfied with their jobs. Consider the elementary school teachers and the high school teachers that were interviewed as two independent groups. Test the claim that the proportion of elementary teachers who are satisfied (p1) is LARGER THAN the proportion of high school teachers who are satisfied (p2), using α=0.05.arrow_forward
 MATLAB: An Introduction with ApplicationsStatisticsISBN:9781119256830Author:Amos GilatPublisher:John Wiley & Sons Inc
 Probability and Statistics for Engineering and th...StatisticsISBN:9781305251809Author:Jay L. DevorePublisher:Cengage Learning
 Statistics for The Behavioral Sciences (MindTap C...StatisticsISBN:9781305504912Author:Frederick J Gravetter, Larry B. WallnauPublisher:Cengage Learning
 Elementary Statistics: Picturing the World (7th E...StatisticsISBN:9780134683416Author:Ron Larson, Betsy FarberPublisher:PEARSON
 The Basic Practice of StatisticsStatisticsISBN:9781319042578Author:David S. Moore, William I. Notz, Michael A. FlignerPublisher:W. H. Freeman
 Introduction to the Practice of StatisticsStatisticsISBN:9781319013387Author:David S. Moore, George P. McCabe, Bruce A. CraigPublisher:W. H. Freeman