
Videos
The paper “Good for Women, Good for Men, Bad for People: Simpson’s Paradox and the Importance of Sex-Specific Analysis in Observational Studies” (Journal of Women’s Health and Gender-Based Medicine [2001]: 867-872) described the results of a medical study in which one treatment was shown to be better for men and better for women than a competing treatment. However, if the data for men and women are combined, it appears as though the competing treatment is better.
To see how this can happen, consider the accompanying data tables constructed from information in the paper. Subjects in the study were given either Treatment A or Treatment B, and survival was noted. Let S be the
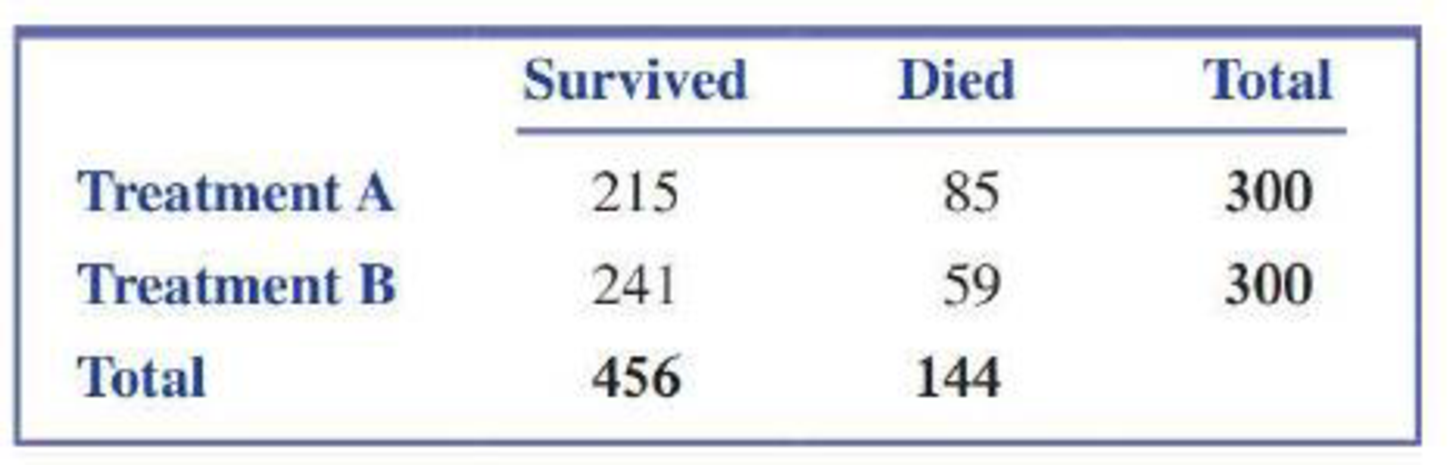
- a. The following table summarizes data for men and women combined:
- i. Find P(S).
- ii. Find P(S|A).
- iii. Find P(S|B).
- iv. Which treatment appears to be better?
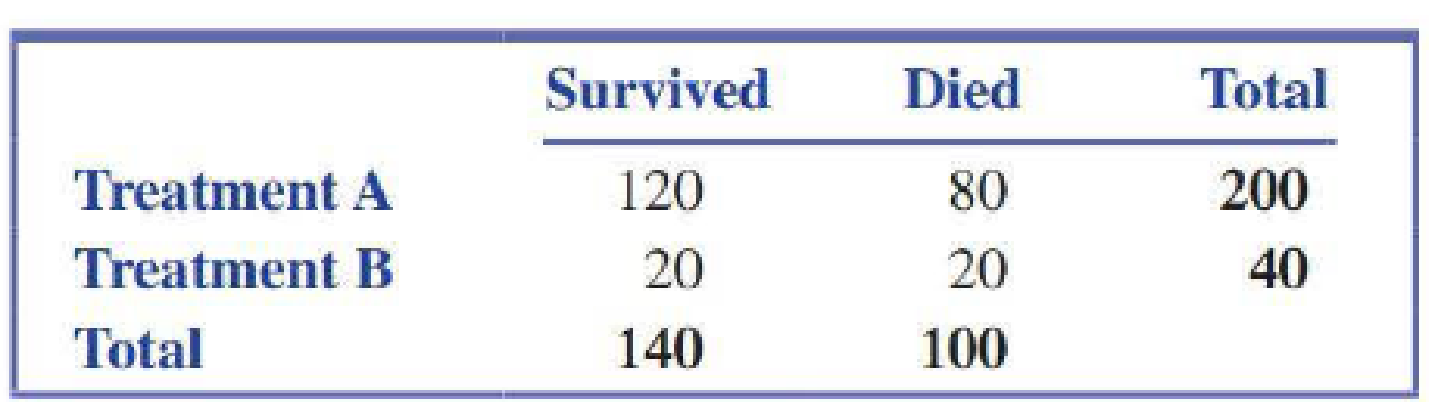
- b. Now consider the summary data for the men who participated in the study:
- v. Find P(S).
- vi. Find P(S|A).
- vii. Find P(S|B).
- viii. Which treatment appears to be better?
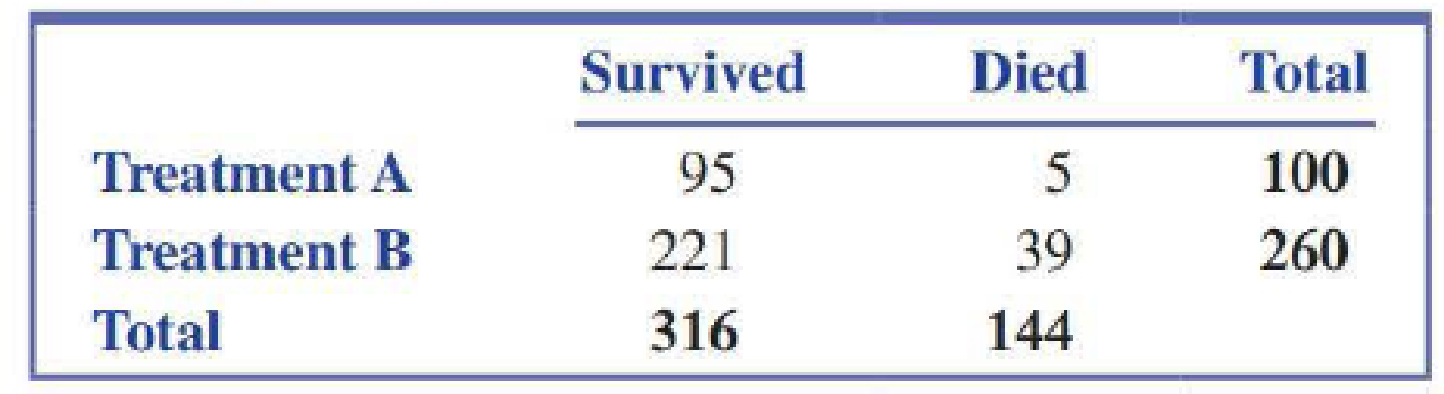
- c. Now consider the summary data for the women who participated in the study:
- ix. Find P(S). looks like Treatment B is better. This is an
- x. Find P(S|A).
- xi. Find P(S|B).
- xii. Which treatment appears to be better?
- d. You should have noticed from Parts (b) and (c) that for both men and women, Treatment A appears to be better. But in Part (a), when the data for men and women are combined, it looks like Treatment B is better. This is an example of what is called Simpson’s paradox. Write a brief explanation of why this apparent inconsistency occurs for this data set. (Hint: Do men and women respond similarly to the two treatments?)
a.
i. Compute
ii. Obtain
iii. Calculate
iv. Find the better treatment.
Answer to Problem 52E
i. The value of
ii. The value of
iii. The value of
iv. Treatment B is better than Treatment A.
Explanation of Solution
Calculation:
The given information is the summary table of the survey. Event S denotes the event that a patient selected at random and survives, event A denotes that a patient selected at random received Treatment A, and B denotes the event that a patient selected at random and received Treatment B.
i.
The probability of any event A is given below:
The total number of randomly selected patient is 600.
The total number of patient selected at random survives is 456.
The probability of a randomly selected patients and who survive is calculated as follows:
Thus, the probability of a randomly selected patients who survive is 0.76.
ii.
Conditional rule:
The formula for probability of E given F is,
The total number of patient selected at random and received Treatment A is 300.
The number of patient selected at random and received Treatment A and survive is 215.
The probability that the selected patients at random received Treatment A, given that the patient selected at random survives. It is calculated as follows:
Thus, the value of
iii.
The total number of patient selected at random and received Treatment B is 300.
The number of patient selected at random that received Treatment B and survive is 241.
The probability that the selected patient at random received Treatment B, given that the patient selected at random survives. It is calculated as follows:
Thus, the value of
iv.
The probability of patient who received Treatment B survived more than that of Treatment A.
Thus, Treatment B is better than Treatment A.
b.
i. Compute
ii. Obtain
iii. Calculate
iv. Find the better treatment.
Answer to Problem 52E
i. The value of
ii. The value of
iii. The value of
iv. Treatment A is better than Treatment B.
Explanation of Solution
Calculation:
The given information is the summary table of the survey.
i.
The total number of randomly selected patient is 240.
The total number of patient selected at random and survives is 140.
The probability of a randomly selected patients who survive is calculated as follows:
Thus, the probability of a randomly selected patients who survive is 0.583.
ii.
Conditional rule:
The formula for probability of E given F is,
The total number of patients selected at random that received Treatment A is 200.
The number of patient selected at random that received Treatment A and survives is 120.
The probability that the selected patient at random received Treatment A, given that the patient selected at random survives. It is calculated as follows:
Thus, the value of
iii.
The total number of patients selected at random that received Treatment B is 40.
The number of patient selected at random that received Treatment B and survive is 20.
The probability that the selected patient at random received Treatment B, given that the patient selected at random survives. It is calculated as follows:
Thus, the value of
iv.
The probability of patient who received Treatment A survived more than that of Treatment B.
Thus, Treatment A is better than Treatment B.
c.
i. Compute
ii. Obtain
iii. Calculate
iv. Find the better treatment.
Answer to Problem 52E
i. The value of
ii. The value of
iii. The value of
iv. Treatment A is better than Treatment B.
Explanation of Solution
Calculation:
The given information is the summary table of the survey.
i.
The total number of randomly selected patient is 360.
The total number of patient selected at random that survive is 316.
The probability of a randomly selected patients who survive is calculated as follows:
Thus, the probability of a randomly selected patients who survive is 0.878.
ii.
Conditional rule:
The formula for probability of E given F is,
The total number of patient selected at random that received Treatment A is 100.
The number of patient selected at random that received Treatment A and survive is 95.
The probability that the selected patients at random received Treatment A, given that the patient selected at random survives. It is calculated as follows:
Thus, the value of
iii.
The total number of patient selected at random that received Treatment B is 260.
The number of patient selected at random that received Treatment B and survive is 221.
The probability that the selected patients at random received Treatment B, given that the patient selected at random survives. It is calculated as follows:
Thus, the value of
iv.
The probability of patients who received Treatment A survived more than that of Treatment B.
Thus, Treatment A is better than Treatment B.
d.
Explain the reason for the existence of apparent inconsistency in the data.
Explanation of Solution
From part (a), (b) and (c), it can be observed that Treatment A performs better than that of Treatment B, except part (a). In part (a), the data for men and women are combined. Thus, Treatment B performs better than that of Treatment A.
Want to see more full solutions like this?
Chapter 6 Solutions
INTRODUCTION TO STATISTICS & DATA ANALYS


- In 2010, Seery, Holman, & Silver found that individuals with some history of adversity report better mental health and well-being compared to people with little to no history of adversity. In an attempt to examine this phenomenon, a researcher surveys a group of college students to determine the negative life events they experienced in the last 5 years and their current feeling of well-being. Participants: With 5-10 negative experiences With 2 or fewer negative experiences n=7 n=7 Well-being score of M=48 Well-being score of M=41 SS=325 SS=347 1. State the hypotheses both experimental and statistical 2. Do the results indicate significantly different reports of Well-being? Use a two-tailed test with a=.05. Please show work and state your decision regarding the H0. 3. Compute the estimated Cohen's d to measure the size of the effect. State…arrow_forwardReviewers from the Oregon Evidence-Based Practice Center at the Oregon Health and Science University investigated the effectiveness of prescription drugs in assisting people to fall asleep and stay asleep (source: S. Carson, M.S. McDonagh, et al., “Drug class review: Newer drugs for insomnia,” Oregon Health and Science University, 2008, http://www.ncbi.nlm.nih.gov). Suppose a study of two drugs, Sonata and Ambien, was conducted and the resulting data are contained in a file titled Shuteye. The samples reflect an experiment in which individuals were randomly given the two brands of pills on separate evenings. Their time spent sleeping was recorded for each of the brands of sleeping pills. (A) Does the experiment seem to have dependent or independent samples? Explain your reasoning. (B) Do the data indicate that there is a statistical difference in the mean time spent sleeping for people using the two drugs? Test using alpha = 0.02. Conduct a statistical procedure to determine this. (C)…arrow_forwardThe article “HIV-positive Smokers Considering Quitting: Differences by Race/Ethnicity” (E. Lloyd-Richardson, C. Stanton, et al., Am J Health Behav, 2008:3–15) reported that in a group of 230 European-American HIV-positive smokers, 102 of them had used a nicotine patch to try to quit smoking, and in a group of 72 Hispanic-American HIV-positive smokers, 20 had used a nicotine patch. Can you conclude that the proportion of patch users is greater among European-Americans?arrow_forward
- A study of “adverse symptoms” in users of over-the-counter pain relief medications assigned subjects at random toone of two common pain relievers: acetaminophen and ibuprofen. In all, 650 subjects took acetaminophen, and 44experienced some adverse symptom. Of the 347 subjects who took ibuprofen, 49 had an adverse symptom. Is thisconvincing evidence that the two pain relievers differ in the proportion of people who experience an adverse symptom?arrow_forwardA low-level CDC bureaucrat wants to please his boss by gathering evidence thatthe current government-mandated shutdown of society is not causing people’s mentalhealth to deteriorate, so that it can safely be continued for several years if anyexpert says it’s necessary.He polls a random sample of 1600 citizens, gathering data on such items asincome loss, weight gain, access to toilet paper, hours spent binge-watchingNetflix, and number of injuries caused by household fights, and compiles all thisinto a scientifically-weighted “misery index”.The mean misery index from the sample is 99.2; it seems reasonable to use apopulation standard deviation σ = 19.1.a) Does this information provide significant evidence (at the 5% level) that thenationwide mean misery index is less than 100? Set up appropriate null andalternative hypotheses, calculate the appropriate test statistic, find the P-value,and state your conclusion. (10)b) A CDC press release publishing the results of this study claims that…arrow_forwardA low-level CDC bureaucrat wants to please his boss by gathering evidence thatthe current government-mandated shutdown of society is not causing people’s mentalhealth to deteriorate, so that it can safely be continued for several years if anyexpert says it’s necessary.He polls a random sample of 1600 citizens, gathering data on such items asincome loss, weight gain, access to toilet paper, hours spent binge-watchingNetflix, and number of injuries caused by household fights, and compiles all thisinto a scientifically-weighted “misery index”.The mean misery index from the sample is 99.2; it seems reasonable to use apopulation standard deviation σ = 19.1.a) Does this information provide significant evidence (at the 5% level) that thenationwide mean misery index is less than 100? Set up appropriate null andalternative hypotheses, calculate the appropriate test statistic, find the P-value,and state your conclusion. b) A CDC press release publishing the results of this study claims that…arrow_forward
- A researcher notes that there seems to be a difference in the prevalence of individuals who are medication adherent and have high levels of education along with a high health literacy and the prevalence of individuals who are not medication adherent and have low levels of education along with a low health literacy. Use the appropriate hypothesis to determine if education level and health literacy status are related (independent) at the 5%. Low Level of Education Low Medication Adherence High Medication Adherence Total Low Health Literacy 91 9 100 High Health Literacy 9 291 300 Total 100 300 400 High Level of Education Low Medication Adherence High Medication Adherence Total Low Health Literacy 96 4 100 High Health Literacy 4 296 300 Total 100 300 400arrow_forwardA U.S. study published in The American Journal of Preventive Medicine compared state-level prevalence of firearm ownership in 2002 with state-level rates of firearm assault and firearm robbery in the subsequent year. The investigators found a positive association - meaning that states with higher prevalence of firearm ownership also tended to be the states with higher rates of firearm assault. Which design best describes this study? a)Observational cohort study b)Randomized trial c)Case-control study d)Ecological studyarrow_forwardLeisure Activities and Dementia. An article appearing in the Los Angeles Times discussed the study “Leisure Activities and the Risk of Dementia in the Elderly” (New England Journal of Medicine, Vol. 348) by J.Verghese et al. The article in the Times, titled “Crosswords Reduce Risk of Dementia,” contained the following statement: “Elderly people who frequently read, do crossword puzzles, practice a musical instrument or play board games cut their risk of Alzheimer’s and other forms of dementia by nearly two-thirds compared with people who seldom do such activities.” Comment on thestatement in quotes, keeping in mind the type of study for which causation can be reasonably inferred.arrow_forward
- In studies examining the effect of humor on interpersonal attractions, McGee and Shevlin (2009) found that an individual’s sense of humor had a significant effect on how the individual was perceived by others. In one part of the study, female college students were given brief descriptions of a potential romantic partner. The fictitious male was described positively as being single and ambitious and having good job prospects. For one group of participants, the description also said that he had a great sense of humor. For another group, it said that he has no sense of humor. After reading the description, each participant was asked to rate the attractiveness of the man on a seven-point scale from 1 (very unattractive) to 7 (very attractive). A score of 4 indicates a neutral rating. The females who read the “great sense of humor” description gave the potential partner an average attractiveness score of M = 4.53 with a standard deviation of s = 1.04. If the sample consisted of n = 16…arrow_forwardWhat can conclude about the null hypothesis from this dataset of weight gain in mice grouped by treatments of diet type and stress level? Weight Diet Stress 10.8 C H 11 C H 9.7 C H 10.1 C H 11.2 C H 9.8 C L 10.7 C L 9.4 C L 9.9 C L 10 C L 12.8 A H 13.9 A H 11.8 A H 13 A H 12 A H 10.9 A L 13.6 A L 10.9 A L 11.5 A L 12.8 A L 9.8 B H 8.8 B H 8 B H 7.6 B H 9 B H 10 B L 8 B L 7.8 B L 7.9 B L 9.2 B Larrow_forwardA U.S. Food Survey showed that Americans routinely eat beef in their diet. Suppose that in a study of 49 consumers in Illinois and 64 consumers in Texas the following results were obtained from two samples regarding average yearly beef consumption: Illinois Texas = 49 = 64 = 54.1lb = 60.4lb S1 = 7.0 S2 = 8.0 Formulate a hypothesis so that, if the null hypothesis is rejected, we can conclude that the average amount of beef eaten annually by consumers in Illinois is significantly less than that eaten by consumers in Texas.arrow_forward
 MATLAB: An Introduction with ApplicationsStatisticsISBN:9781119256830Author:Amos GilatPublisher:John Wiley & Sons Inc
 Probability and Statistics for Engineering and th...StatisticsISBN:9781305251809Author:Jay L. DevorePublisher:Cengage Learning
 Statistics for The Behavioral Sciences (MindTap C...StatisticsISBN:9781305504912Author:Frederick J Gravetter, Larry B. WallnauPublisher:Cengage Learning
 Elementary Statistics: Picturing the World (7th E...StatisticsISBN:9780134683416Author:Ron Larson, Betsy FarberPublisher:PEARSON
 The Basic Practice of StatisticsStatisticsISBN:9781319042578Author:David S. Moore, William I. Notz, Michael A. FlignerPublisher:W. H. Freeman
 Introduction to the Practice of StatisticsStatisticsISBN:9781319013387Author:David S. Moore, George P. McCabe, Bruce A. CraigPublisher:W. H. Freeman