
Concept explainers
a)
To determine: The control limits for the mean and range chart and the overall means
Introduction: Control charts used to determine whether the process is under control or not. Attributes and variables are the factors under the control charts.
a)
Answer to Problem 11P
Hence, the UCL for
Explanation of Solution
Given information:
The following information is given:
| Sample | Sample mean (in.) | Range (in.) |
| 1 | 10.002 | 0.011 |
| 2 | 10.002 | 0.014 |
| 3 | 9.991 | 0.007 |
| 4 | 10.006 | 0.022 |
| 5 | 9.997 | 0.013 |
| 6 | 9.999 | 0.012 |
| 7 | 10.001 | 0.008 |
| 8 | 10.005 | 0.013 |
| 9 | 9.995 | 0.004 |
| 10 | 10.001 | 0.011 |
| 11 | 10.001 | 0.014 |
| 12 | 10.006 | 0.009 |
Twelve samples that contain five parts each were taken.
Calculate the average for sample and range:
| Sample | Sample mean (in.) | Range (in.) |
| 1 | 10.002 | 0.011 |
| 2 | 10.002 | 0.014 |
| 3 | 9.991 | 0.007 |
| 4 | 10.006 | 0.022 |
| 5 | 9.997 | 0.013 |
| 6 | 9.999 | 0.012 |
| 7 | 10.001 | 0.008 |
| 8 | 10.005 | 0.013 |
| 9 | 9.995 | 0.004 |
| 10 | 10.001 | 0.011 |
| 11 | 10.001 | 0.014 |
| 12 | 10.006 | 0.009 |
| Total | 120.006 | 0.138 |
| Average | 10.0005 | 0.0115 |
Working note:
Average for sample:
It is calculated by dividing the total of sample and number of samples. Hence, the value of
Average for range:
It is calculated by dividing the total of range and number of samples. Hence, the value of
Determine the UCL and LCL for mean:
Formulae to calculate control limits:
Here, the overall mean
Substitute the values in equation (1) to determine the value of UCL as follows:
Hence, the UCL value is 10.00714.
Substitute the values in equation (2) to determine the value of LCL as follows:
Hence, the LCL value is 9.993865.
Therefore for the
Determine the UCL and LCL for range:
Formulae to calculate control limits:
Here,
The average range is
Substitute the values in equation (3) to determine the value of UCL as follows:
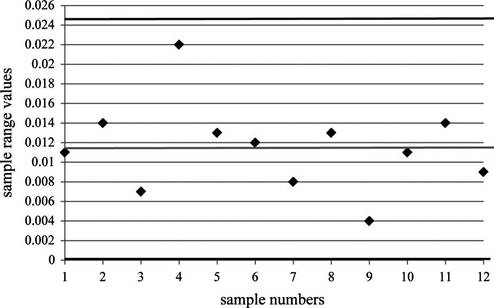
Hence, the UCL value is 0.024323.
Substitute the values in equation (4) to determine the value of LCL as follows:
Hence, the LCL value is 0.
Therefore, for the R-chart, the upper control limit is
b)
To plot: The values of sample means and ranges in the chart.
Introduction: Control charts used to determine whether the process is under control or not. Attributes and variables are the factors under the control charts.
b)
Answer to Problem 11P
Control chart has been plotted for sample means and ranges.
Explanation of Solution
Given information:
The following information is given:
| Sample | Sample mean (in.) | Range (in.) |
| 1 | 10.002 | 0.011 |
| 2 | 10.002 | 0.014 |
| 3 | 9.991 | 0.007 |
| 4 | 10.006 | 0.022 |
| 5 | 9.997 | 0.013 |
| 6 | 9.999 | 0.012 |
| 7 | 10.001 | 0.008 |
| 8 | 10.005 | 0.013 |
| 9 | 9.995 | 0.004 |
| 10 | 10.001 | 0.011 |
| 11 | 10.001 | 0.014 |
| 12 | 10.006 | 0.009 |
Twelve samples that contain five parts each were taken.
Plot the sample mean values in the
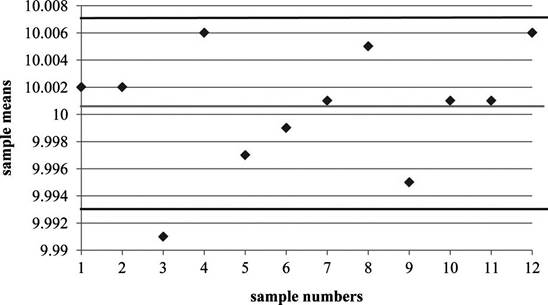
Note: Observe that sample 3 mean value is lower than the
Plot the sample mean values in theR-control chart where
c)
To determine: Whether the process is in control
Introduction: Control charts used to determine whether the process is under control or not. Attributes and variables are the factors under the control charts.
c)
Answer to Problem 11P
Process is out of control during sample #3 in
Explanation of Solution
Given information:
The following information is given:
| Sample | Sample mean (in.) | Range (in.) |
| 1 | 10.002 | 0.011 |
| 2 | 10.002 | 0.014 |
| 3 | 9.991 | 0.007 |
| 4 | 10.006 | 0.022 |
| 5 | 9.997 | 0.013 |
| 6 | 9.999 | 0.012 |
| 7 | 10.001 | 0.008 |
| 8 | 10.005 | 0.013 |
| 9 | 9.995 | 0.004 |
| 10 | 10.001 | 0.011 |
| 11 | 10.001 | 0.014 |
| 12 | 10.006 | 0.009 |
Twelve samples that contain five parts each were taken.
Determine whether the process is in control:
Since, the mean for sample #3 is outside the control limits of the
d)
To determine: Why the process is not in control
Introduction: Control charts used to determine whether the process is under control or not. Attributes and variables are the factors under the control charts.
d)
Explanation of Solution
Given information:
The following information is given:
| Sample | Sample mean (in.) | Range (in.) |
| 1 | 10.002 | 0.011 |
| 2 | 10.002 | 0.014 |
| 3 | 9.991 | 0.007 |
| 4 | 10.006 | 0.022 |
| 5 | 9.997 | 0.013 |
| 6 | 9.999 | 0.012 |
| 7 | 10.001 | 0.008 |
| 8 | 10.005 | 0.013 |
| 9 | 9.995 | 0.004 |
| 10 | 10.001 | 0.011 |
| 11 | 10.001 | 0.014 |
| 12 | 10.006 | 0.009 |
Twelve samples that contain five parts each were taken.
Determine why the process is not in control:
Further investigations are necessary to check whether the mean value of sample #3 is a freak incident outside the three sigma limits (which has a 0.27% probability). Perhaps 12 more samples can be drawn and examined whether such an incident occurs again. In case it happens again, the process needs to be examined in detail.
Want to see more full solutions like this?
Chapter 6 Solutions
EBK PRINCIPLES OF OPERATIONS MANAGEMENT


- Your supervisor, Lisa Lehmann, has asked that you report on the output of a machine on the factory floor. This machine is supposed to be producing optical lenses with a meanweight of 50 grams and a range of 3.5 grams. The following table contains the data for a sample size of n = 6 taken during the past 3 hours: a) What are the :X-chart control limits when the machine is working properly?b) What are the R-charL control limits when the machine is working properly?c) What seems to be happening? (Hint: Graph the data points. Run charts may be helpful.)arrow_forward1. Twenty samples, each consisting of 100 admission applications at a university, resulted in a total of 80 applications that had some type of error. Compute the control limits for a p-chart. What would be the impact on the final results if each sample contained 200 loan applications rather than 100 and all other data remained the same? Please show in detail these impacts quantitatively in your answers.arrow_forwardYou work for Raider Data Systems where thousands of insurance records are entered by clerks each day for a variety of client firms. You are in charge of setting control limits to include 99.73% of the random variation in the data entry process when it is in control. Samples that you collected from 20 employees are shown below. You carefully examine 100 records entered by each employee and count the number of errors entered by each clerk. You also compute the proportion defective in each sample. Using a p-chart, what are the upper and lower control limits? Sample Errors Made Proportion Defective 1 4 0.04 2 5 0.05 3 6 0.06 4 3 0.03 5 8 0.08arrow_forward
- Aspen Plastics produces plastic bottles to customer order.The quality inspector randomly selects four bottles fromthe bottle machine and measures the outside diameter ofthe bottle neck, a critical quality dimension that determineswhether the bottle cap will fit properly. The dimensions(inch) from the last six samples are Assume that only these six samples are sufficient, and use thedata to determine control limits for an R- and an x-chart.arrow_forwardWhich of the following elements is not part of an X-bar control chart?a. The long-run center line, X-bar-barb. The control limits, LCL and UCLc. The specification limits, LSL and USLd. X-bar values from each samplearrow_forwardA process considered to be in control measures an ingredient in ounces. Roberto Baggio, a quality inspector took 20 samples, each with 8 observations as follows: thats in the pictuer after that using this information, obtain three-sigma (i.e., z=3) control limits for a mean control chart and control limits for a range chart, respectively. It is known from previous experience that the standard deviation of the process is 0.693. First: perform all actions and calculations needed to answer the question. All equations/calculations needed to be fully written STEP by STEP. No short calculations or direct answers/results will be accepted. This applies to the calculations for both types of control limits (mean and range). Second: Explain the process followed to identify each type of control limit and any observations made in the problem-solving process. thank you very mucharrow_forward
- A quality inspector took five samples in five hours, each with four observations, of the length time for glue to dry. The analyst compute the mean of each sample and the computed the grand mean. All values are in minutes. Use this information to obtain three-sigma control limits for means. It is known from previous experience that the standard deviation of the process is 0.02 minutes. Draw a control chart Please provide a step-by-step solutionarrow_forwardA process considered to be in control measures an ingredient in ounces. A quality inspector took 10 samples, each with 5 observations as follows: SEE ATTACHED PHOTO Using this information, obtain three-sigma (i.e., z=3) control limits for a mean control chart and control limits for a range chart, respectively. It is known from previous experience that the standard deviation ofthe process is 1.36.arrow_forward A fast food franchise tracked the number of errors that occurred in customers orders. These included; * wrong menu items *wrong size drink *lack of condiments *wrong price total *and so on... Some orders may have more than one error. In one week, 1500 orders were filled, and a total of 72 errors were discovered. Find the control limits for a C – Chart to monitor the number of errors per order. Is order accuracy, good or bad ? Explain.arrow_forward
- Thirty-five samples of size 7 each were taken from afertilizer-bag-filling machine. The results were overall mean =57.75 lb; average range = 1.78 lb.a) Determine the upper and lower control limits of the x -chart,where s = 3.b) Determine the upper and lower control limits of the R -chart,where s = 3.arrow_forwardFor 50 consecutive days, a process engineer has measured the weight of acomponent after it has been coated with a special paint. Each day, she takes a sampleof 10 components. The average across all 500 components (50 days, 10 componentsper day) is 45.343018 grams. The standard deviation across all parts is 0.0076382 gram.When constructing an X-bar chart, what would be the center line and what would be thelines for the upper and lower control limits?arrow_forward7. An ad agency tracks the complaints, by week received, about the billboards in its city: Week No. of Complaints 1 3 2 6 3 4 4 12 5 2 6 9 This exercise contains only parts a, b, and c. Part 2 a) The type of control chart that is best to monitor this process is c minus chart ______ . Part 3 b) Using z = 3, the control chart limits for this process are (assume that the historical complaints rate is unknown): UCLc = ________ complaints per week (round your response to two decimal places). The upper control limit is: ________ The lower control limit is: _________ The central limit is ___________arrow_forward
 Practical Management ScienceOperations ManagementISBN:9781337406659Author:WINSTON, Wayne L.Publisher:Cengage,
 Operations ManagementOperations ManagementISBN:9781259667473Author:William J StevensonPublisher:McGraw-Hill Education
 Operations and Supply Chain Management (Mcgraw-hi...Operations ManagementISBN:9781259666100Author:F. Robert Jacobs, Richard B ChasePublisher:McGraw-Hill Education
 Purchasing and Supply Chain ManagementOperations ManagementISBN:9781285869681Author:Robert M. Monczka, Robert B. Handfield, Larry C. Giunipero, James L. PattersonPublisher:Cengage Learning
 Production and Operations Analysis, Seventh Editi...Operations ManagementISBN:9781478623069Author:Steven Nahmias, Tava Lennon OlsenPublisher:Waveland Press, Inc.