
Concept explainers
a)
To determine: The value of
Introduction: Control charts used to determine whether the process is under control or not. Attributes and variables are the factors under the control charts.
a)
Answer to Problem 7P
Hence, the value of
Explanation of Solution
Given information:
The following information is given:
| Day | Mean (MM) | Range (MM) |
| 1 | 156.9 | 4.2 |
| 2 | 153.2 | 4.6 |
| 3 | 153.6 | 4.1 |
| 4 | 155.5 | 5 |
| 5 | 156.6 | 4.5 |
Determine the value of
| Day | Mean (MM) |
| 1 | 156.9 |
| 2 | 153.2 |
| 3 | 153.6 |
| 4 | 155.5 |
| 5 | 156.6 |
| Total | 775.8 |
Calculate the
It is calculated by dividing the sum of mean values and the number of days.
Hence, the value of
b)
To determine: The value of
Introduction: Control charts used to determine whether the process is under control or not. Attributes and variables are the factors under the control charts.
b)
Answer to Problem 7P
Hence, the value of
Explanation of Solution
Given information:
The following information is given:
| Day | Mean (MM) | Range (MM) |
| 1 | 156.9 | 4.2 |
| 2 | 153.2 | 4.6 |
| 3 | 153.6 | 4.1 |
| 4 | 155.5 | 5 |
| 5 | 156.6 | 4.5 |
Determine the value of
| Day | Range (MM) |
| 1 | 4.2 |
| 2 | 4.6 |
| 3 | 4.1 |
| 4 | 5 |
| 5 | 4.5 |
| Total | 22.4 |
Calculate the
It is calculated by dividing the sum of mean values and the number of days.
Hence, the value of
c)
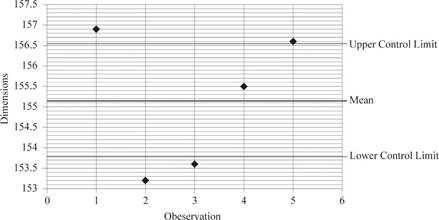
To plot: The UCL and LCL for
Introduction: Control charts used to determine whether the process is under control or not. Attributes and variables are the factors under the control charts.
c)
Answer to Problem 7P
Hence, the value of UCL is 156.54mm and LCL is 153.78mm.
Explanation of Solution
Given information:
The following information is given:
| Day | Mean (MM) | Range (MM) |
| 1 | 156.9 | 4.2 |
| 2 | 153.2 | 4.6 |
| 3 | 153.6 | 4.1 |
| 4 | 155.5 | 5 |
| 5 | 156.6 | 4.5 |
Determine the UCL and LCL of
Formulae to determine Upper Control Limit and Lower Control Limit are given as follows:
Here, the overall mean is
Given the sample size of 10, the Mean factor
Substitute the values in the given formulae:
Upper control limit can be calculated by adding the multiple of average range and mean factor with the overall mean.
Lower control limit can be calculated by subtracting the multiple of average range and mean factor from the overall mean.
Hence, upper control limit is 156.54mm and 153.78mm.
Plot the values:
d)
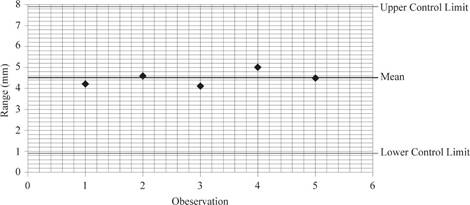
To plot: The UCL and LCL for
Introduction: Control charts used to determine whether the process is under control or not. Attributes and variables are the factors under the control charts.
d)
Answer to Problem 7P
Hence, the value of UCL is 7.96mm and LCL is 0.999mm.
Explanation of Solution
Given information:
The following information is given:
| Day | Mean (MM) | Range (MM) |
| 1 | 156.9 | 4.2 |
| 2 | 153.2 | 4.6 |
| 3 | 153.6 | 4.1 |
| 4 | 155.5 | 5 |
| 5 | 156.6 | 4.5 |
Determine the UCL and LCL of
Formulae to determine Upper Control Limit and Lower Control Limit are given as follows:
Here, the average range is
Given the sample size of 10 for
Substitute the values in the given formulae:
Upper control limit can be calculated by multiplying upper range factor and average range.
Upper control limit can be calculated by multiplying lower range factor and average range.
Hence, upper control limit is 7.96mm and 0.999mm.
Plot the values:
e)
To determine: The UCL and LCL for
Introduction: Control charts used to determine whether the process is under control or not. Attributes and variables are the factors under the control charts.
e)
Answer to Problem 7P
Hence, the value of UCL is 156.38mm and LCL is 153.62mm.
Explanation of Solution
Given information:
The following information is given:
| Day | Mean (MM) | Range (MM) |
| 1 | 156.9 | 4.2 |
| 2 | 153.2 | 4.6 |
| 3 | 153.6 | 4.1 |
| 4 | 155.5 | 5 |
| 5 | 156.6 | 4.5 |
Given the target value of the diameter
Here,
The target value of the diameter
Given the sample size of 10, the Mean factor
Substitute the values in the given formulae:
Upper control limit can be calculated by adding the multiple of average range and mean factor with the overall mean.
Lower control limit can be calculated by subtracting the multiple of average range and mean factor from the overall mean.
Hence, for the
Want to see more full solutions like this?
Chapter 6 Solutions
EBK PRINCIPLES OF OPERATIONS MANAGEMENT


- McDaniel Shipyards wants to develop control charts to assess the quality of its steel plate. They take ten sheets of 1" steel plate and compute the number of cosmetic flaws on each roll. Each sheet is 20' by 100'. Based on the following data, develop limits for the control chart, plot the control chart, and determine whether the process is in control. Sheet Number of flaws 1 1 2 1 3 2 4 0 5 1 6 5 7 0 8 2 9 0 10 2arrow_forwardBottles for room spray are supposed to weigh exactly oz. Inspectors want to develop process control charts . They take six boxes of five bottles each and weigh them . They obtain the following data . The mean weights of each of the 6 samples are 15.2, 14.6, 16.5, 18.1, 13.2 , and 14.8 respectively . Likewise , the range values for the each of 6 samples are 1.8, 0.7, 0.5, 0.4, 0.2 , and 0.9 respectively . Find out Grand Mean (X double bar ), and mean range (R bar )arrow_forwardWebster Chemical Company produces mastics and caulking for the construction industry. The product is blended in large mixers and then pumped into tubes and capped. Management is concerned about whether the filling process for tubes of caulking is in statistical control. The process should be centered on 8 ounces per tube. Several samples of eight tubes were taken, each tube was weighed, and the weights in Table were obtained. Ounces of Caulking Per Tube Tube Number Sample 1 2 3 4 5 6 7 8 1 2 3 4 5 6 7.98 8.33 7.89 8.24 7.87 8.13 8.34 8.22 7.77 8.18 8.13 8.14 8.02 8.08 7.91 7.83 7.92 8.11 7.94 8.51 8.04 8.05 7.99 8.13 8.44 8.41 8.00 7.90 8.10 8.14 7.68 8.28 7.89 8.16 7.81 8.12 7.81 8.09 7.93 7.97 8.14 8.13 8.11 8.16 8.09 8.07 7.88 8.14 a. Assume that only six samples are sufficient and develop the control charts for the mean and the range.b. Plot the observations on the control chart and comment on your findings.arrow_forward
- A process considered to be in control measures an ingredient in ounces. A quality inspector took 10 samples, each with 5 observations as follows: SEE ATTACHED PHOTO Using this information, obtain three-sigma (i.e., z=3) control limits for a mean control chart and control limits for a range chart, respectively. It is known from previous experience that the standard deviation ofthe process is 1.36.arrow_forwardBlueMoon Bottlers has a bottle-filling process with a mean value of 64 ounces and a standard deviation of 8 ounces. Suppose the upper and lower specification limits are 71 and 57 ounces, respectively. What is the process capability index of this process? (Note: You MUST show every single step and detailed derivation for full credit)arrow_forwardThe specification limits for a product are 9.9 cm and 12.35 cm. A process that produces the product has a mean of 11.18 cm and a standard deviation of 0.52 cm. What is the process capability, Cpk? a. 0.8205 b. 1.571 c. 0.7853 d. 0.75arrow_forward
- Webster Chemical Company produces mastics and caulkingfor the construction industry. The product is blended inlarge mixers and then pumped into tubes and capped.Management is concerned about whether the filling processfor tubes of caulking is in statistical control. The processshould be centered on 8 ounces per tube. Several samplesof eight tubes were taken, each tube was weighed, and theweights in Table 3.3 were obtained. a. Assume that only six samples are sufficient and developthe control charts for the mean and the range.b. Plot the observations on the control chart and commenton your findings.arrow_forwardAn operator wants to determine the standard deviation for a machine she operates. To do this, she wants to create a p-chart. Over a month's time, she collects 30 samples of 75 observations each and records the number of errors. The average proportion defective is found to be 0.024. Which of the following is the standard deviation () of the machine? a. More than 0.5 but less than or equal to 1.0 b. More than 1.0 c. Less than or equal to 0.1 d. More than 0.1 but less than or equal to 0.5arrow_forwardA process considered to be in control measures an ingredient in ounces. Roberto Baggio, a quality inspector took 20 samples, each with 8 observations as follows: thats in the pictuer after that using this information, obtain three-sigma (i.e., z=3) control limits for a mean control chart and control limits for a range chart, respectively. It is known from previous experience that the standard deviation of the process is 0.693. First: perform all actions and calculations needed to answer the question. All equations/calculations needed to be fully written STEP by STEP. No short calculations or direct answers/results will be accepted. This applies to the calculations for both types of control limits (mean and range). Second: Explain the process followed to identify each type of control limit and any observations made in the problem-solving process. thank you very mucharrow_forward
- P-chart and c-chart. Using the appropriate control chart, determine two-sigma controllimits for each Problem case, a. An inspector found an average of 3.9 scratches in the exterior paint of each of theautomobiles being prepared for shipment to dealers. b. Before shipping lawnmowers to dealers, an inspector attempts to start each mowerand notes any that do not start on the first try. The lot size is 100 mowers, and anaverage of 4 did not start (4 percent).arrow_forwardCheckout time at a supermarket is monitored using a mean and a range chart. Six samples of n = 20 observations have been obtained and the sample means and ranges computed: Sample Mean Range 1 3.06 .42 2 3.15 .50 3 3.11 .41 4 3.13 .46 5 3.06 .46 6 3.09 .45 Using the factors in Table 10.3 , determine upper and lower limits for mean and range charts. Is the process in control?arrow_forwardNgqabutho Ltd produces plastic bottles to customer’s order. The quality inspector randomly selectsfour bottles from the bottle machine and gathers the following data ( see image) 1. Assume that only these six samples are sufficient, and use the data to determine controllimits for an R (range)- and an X (mean) chart. ( 2. Suppose that the specification for the bottle neck diameter is 0.600 ± 0.050 and thepopulation standard deviation is 0.013 in. What are the process capability index and theprocess capability ratio?arrow_forward
 Practical Management ScienceOperations ManagementISBN:9781337406659Author:WINSTON, Wayne L.Publisher:Cengage,
 Operations ManagementOperations ManagementISBN:9781259667473Author:William J StevensonPublisher:McGraw-Hill Education
 Operations and Supply Chain Management (Mcgraw-hi...Operations ManagementISBN:9781259666100Author:F. Robert Jacobs, Richard B ChasePublisher:McGraw-Hill Education
 Purchasing and Supply Chain ManagementOperations ManagementISBN:9781285869681Author:Robert M. Monczka, Robert B. Handfield, Larry C. Giunipero, James L. PattersonPublisher:Cengage Learning
 Production and Operations Analysis, Seventh Editi...Operations ManagementISBN:9781478623069Author:Steven Nahmias, Tava Lennon OlsenPublisher:Waveland Press, Inc.